Naveen Chandra

Information Action Value Chain
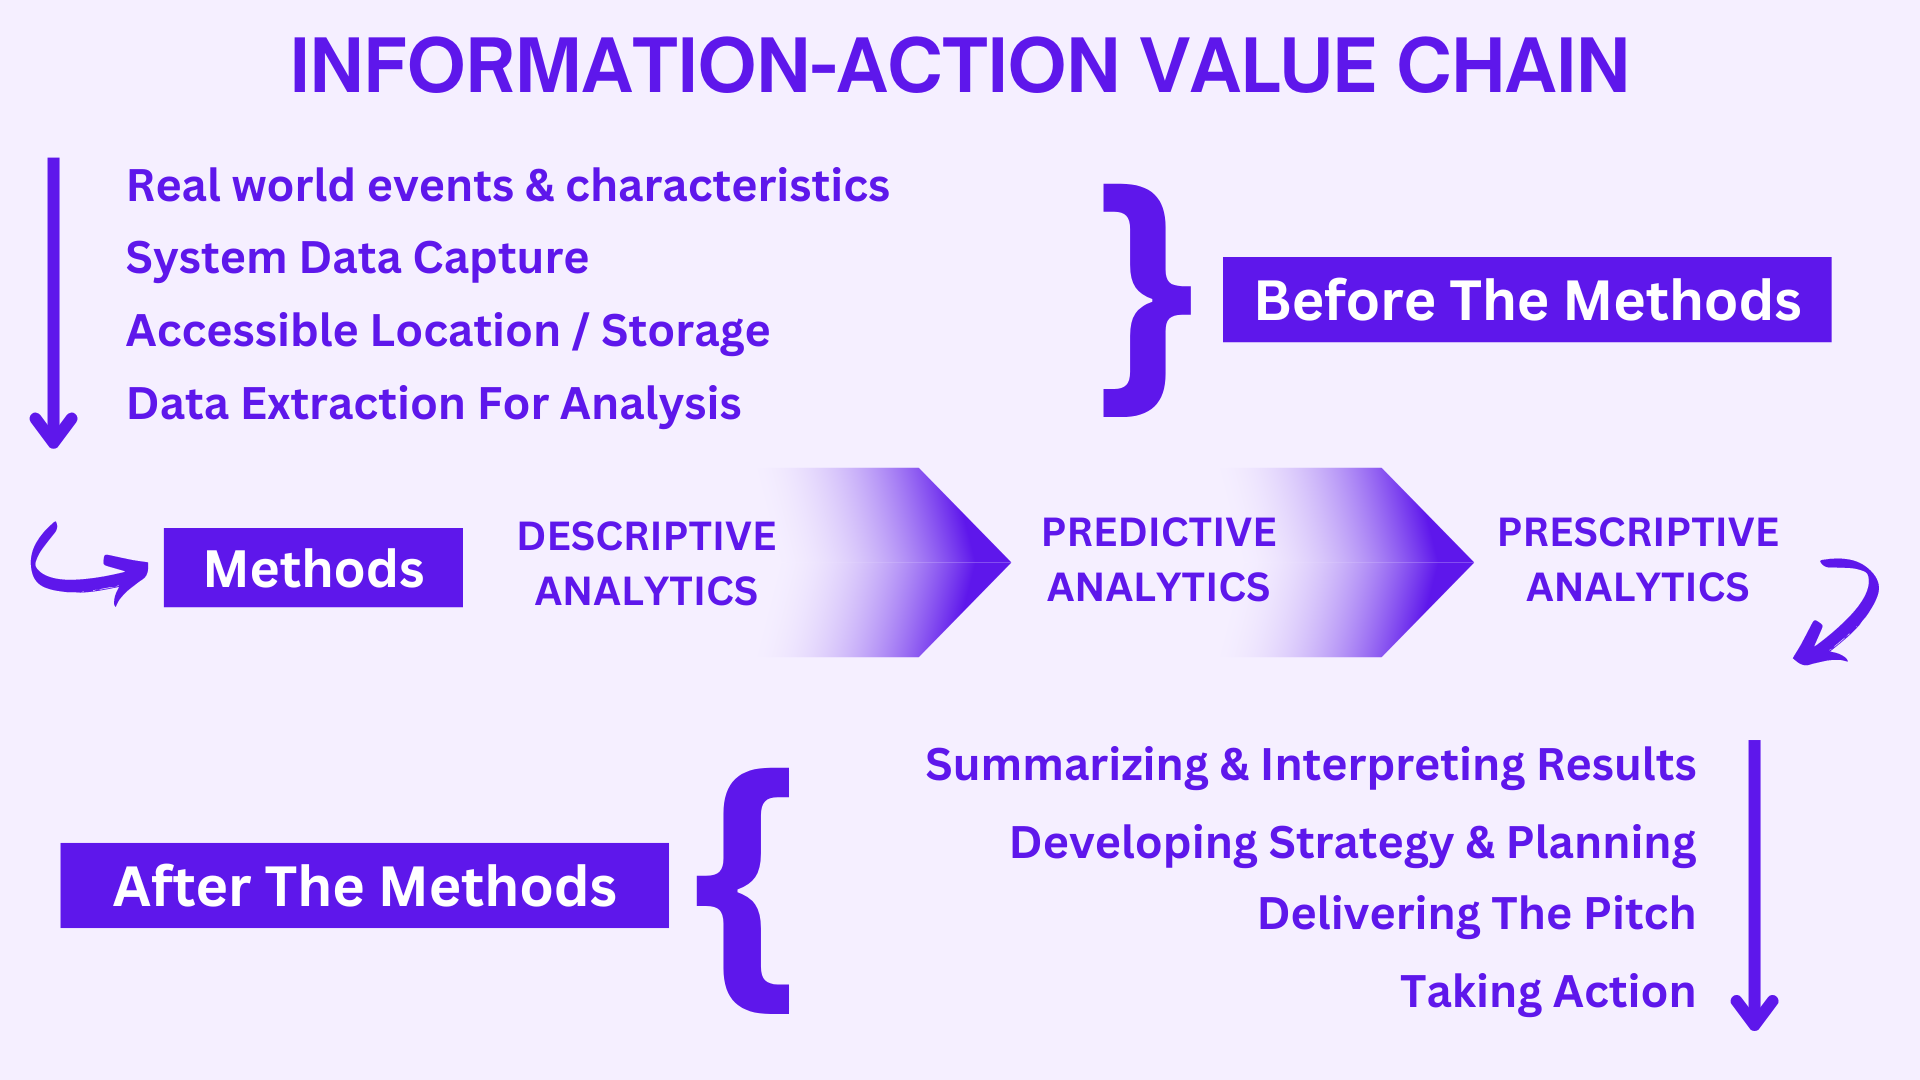
The information-action value chain is a framework that helps organizations understand how information can be used to create value. It basically consists of three parts, namely before the methods, the methods and after the methods.

Before the methods describes the data being generated, captured, stored and then using the particular data for being analysed.

  1. Real world events & characteristics: Everything starts with this real world, and the events & circumstances happening here.
  2. System Data Capture: Events need to be captured by source systems & then turned into data.
  3. Accessible Location / Storage: Data from source systems can be brought into one common location for access & storage.
  4. Data Extraction for Analysis: Extracting only the data we need for analysis.

Now comes the methods through which the data extracted will be analysed. There are mainly three methods:

  1. Descriptive Analytics: Descriptive Analytics helps us describe what things look like or what happened in the past. It can take forms of simple aggregations or cross tabulations data. Simple statistical measures like means, median 7 standard deviations are used. In sophisticated measures, distributions, confidence intervals & hypotheses tests are used. Know More about descriptive analytics in our detailed blog here.
  2. Predictive Analytics: Predictive Analytics helps us take what we know about what happened in the past, & use that information to help us predict what will happen in the future. This analytical method involved application of advanced statistical methods or other numeric techniques such as linear regression or logistic regression. Know More about predictive analytics in our detailed blog here.
  3. Prescriptive Analytics: Prescriptive Analytics helps explicitly link analysis to decision making by making recommendations on what we should do or what choice we should make to achieve a certain outcome. This analytical method uses predictions generated during Predictive Analytics and then uses & involves integration of numerical optimisation techniques with business rules and even financial models. Know More about prescriptive analytics in our detailed blog here.

Also, there are two more analytical methods, namely Real Time Analytics & Diagnostic Analytics. I will also cover these two in my coming blog.

After applying the analytical methods for analysing the data, now comes the after methods processes for interpreting the results, delivering and taking actions for the stakeholders. The steps include:

  1. Summarising & Interpreting Results: This process of organizing and presenting the findings of an analysis in a concise and easy-to-understand way. This can be done through tables, charts, graphs, or written descriptions. Interpreting Result can be done by considering the research questions, the data, and the analytical methods used. The following are some important considerations when summarizing and interpreting results:
  • The audience for the results: Who will be reading or hearing the results? What level of detail is appropriate?
  • The purpose of the analysis: What are the research questions that the analysis was designed to answer?
  • The data: What data was collected? What are the limitations of the data?
  • The analytical methods: What analytical methods were used? How reliable and valid are the methods?
  1. Developing Strategy & Planning: After using the analytical methods, it can be used to develop strategy and planning by providing insights into the current situation, identifying opportunities and threats, and assessing the feasibility of different options. By using analytical methods, organizations can develop more informed and effective strategies and plans. Here are some additional benefits of using analytical methods in strategy and planning:
  • Improved decision-making: By using analytical methods to gather and analyse information, organizations can make better decisions about their future direction.
  • Increased efficiency: By identifying and eliminating waste, organizations can improve their efficiency and reduce costs.
  • Enhanced customer focus: By understanding customer needs, organizations can provide a more personalized and relevant experience.
  • Increased innovation: By identifying new opportunities, organizations can innovate and stay ahead of the competition.
  1. Delivering The Pitch: This generally involves the steps regarding the clarity, simplicity, values & qualities the analysis report contains after preforming the complete information chain. This includes the analyst stand towards the stakeholders needs for their requirements in their business.
  2. Taking Action: This step is used to support decision-making by providing insights into the likely outcomes of different choices. For example, a company might use analytical methods to help it decide whether to enter a new market or launch a new product. These can be the actions taken on the basis of analysing the required data for the stakeholder’s requirement.

The information-action value chain is a continuous process. As new data is collected, it is fed back into the process to generate new insights and drive new actions.

Here are some examples of how organizations are using the information-action value chain to create value:

  • A retailer uses data from its point-of-sale systems to track customer behaviour and identify trends. This information is used to optimize inventory levels, target marketing campaigns, and improve customer service.
  • A manufacturing company uses data from its sensors to monitor the performance of its equipment. This information is used to identify potential problems before they cause outages, improve efficiency, and reduce costs.
  • A healthcare provider uses data from electronic health records to identify patients who are at risk for severe diseases. This information is used to provide preventive care and improve patients’ health.

The information-action value chain is a powerful tool that can help organizations improve their decision-making, identify new opportunities, and create value.

Here are some of the benefits of using the information-action value chain:

  • Improved decision-making: By using data to inform their decisions, organizations can make better choices about how to allocate resources, develop new products and services, and improve customer service.
  • Increased efficiency: By identifying and eliminating waste, organizations can improve their efficiency and reduce costs.
  • Enhanced customer experience: By using data to understand customer needs, organizations can provide a more personalized and relevant experience.
  • Increased innovation: By using data to identify new opportunities, organizations can innovate and stay ahead of the competition.

If you are looking to improve your business or organization’s performance, the information-action value chain is a framework that you should consider.

 

EDA - Exploratory Data Analysis

Exploratory Data Analysis (EDA) is a statistical method that helps you understand your data by summarizing its most important features through statistical graphs and other data visualization methods. 

EDA is often used as the first step in data analysis and can be used to: 

  • Identify the most important features of the information. 
  • Identify outliers. 
  • Check for missing values and errors. 
  • Explore relationships between variables. 
  • Create hypotheses from the data. 

EDA is a non-parametric approach to data analysis, meaning that it makes no assumptions about the distribution of the data. This makes it a versatile tool that can be used to analyse a variety of data sets. There are many different techniques that can be used in EDA. 

Some of the most common techniques include: 

Histograms: Histograms show the distribution of a variable by counting the number of observations in each range of values. 

Box: A box shows the distribution of a variable by showing the median, quartiles and standard deviations. 

Disc charts: Disc charts show the relationship between two variables by plotting the values of one variable against the values of the other variable. 

Correlation matrices: Correlation matrices show the correlation between all pairs of variables in a data set. 

Heatmaps: Heatmaps are a type of correlation matrix that shows the correlation between variables as a color-coded map. 

EDA is an important tool in data analysis. This can help you make sense of your data and generate hypotheses based on the data. EDA can also help you identify potential problems in your data, such as outliers and missing values. If you are new to data analysis, I suggest you start by learning about EDA. It’s a powerful tool to help you get the most out of your data. 

Here are some benefits of using EDA: 

This will help you better understand your data. 

  • This can help you identify patterns and trends in your data. 
  • This can help you identify anomalies and outliers in your data. 
  • This will help you check your data for missing values and errors. 
  • This can help you explore relationships between variables in your data. 
  • This can help you generate hypotheses based on the data. 

If you are working on data analysis, I recommend using EDA as a first step. This will help you better understand your data and identify potential problems. This can save time and effort in the long run. 

Importance of EDA: EDA is an important step in any data analysis project. It is the process of examining your data to understand its characteristics and identify potential problems. 

Different EDAs: There are many different techniques that can be used in EDA. 

Some of the more common techniques include: 

  • Univariate Analysis: This involves analyzing a single variable to understand its distribution and main characteristics. 
  • Bivariate Analysis: This involves analyzing the relationship between two variables. 
  • Multivariate Analysis: It involves analyzing the relationship between several variables. 

Advantages of using EDA: 

There are many advantages of using EDA, including: 

  • This will help you better understand your data. 
  • This can help you identify patterns and trends in your data. 
  • This can help you identify anomalies and outliers in your data. 
  • This will help you check your data for missing values and errors. 
  • This can help you explore relationships between variables in your data. 
  • This can help you generate hypotheses based on the data. 

Steps of EDA: The steps of EDA can vary depending on the specific data set and the goals of the analysis. 

But some common steps include: 

  • Explore the data: This involves gaining an understanding of the data, including its size, format and distribution. 
  • Data cleaning: This means removing errors or inconsistencies in the data. 
  • Data analysis: This involves using statistical methods to examine data and identify patterns and trends. 
  • Interpretation of results: This involves understanding the results of the analysis and drawing conclusions from the data. 

Tools used in EDA : There are many different tools that can be used in EDA. 

Some of the most popular tools are: 

  • Python: Python is a powerful programming language that can be used to analyse data. It has a wide range of libraries and tools that can be used in EDA. 
  • R: R is another popular programming language for data analysis. It has a large community of users and developers, and many resources are available for learning R. 
  • Tableau: Tableau is a data visualization tool that can be used to create interactive dashboards and reports. It is easy to use and can be used to create beautiful and informative visualizations. 
  • Power BI: Power BI is another data visualization tool that can be used to create interactive dashboards and reports. It is more powerful than Tableau and can be used to create more complex visualizations. 

EDA is a valuable tool that can be used to understand your data and identify potential problems. This is an important step in any data analysis project.

Structured Data & Unstructured Data

Structured data and unstructured data are two types of data commonly used in the field of data science

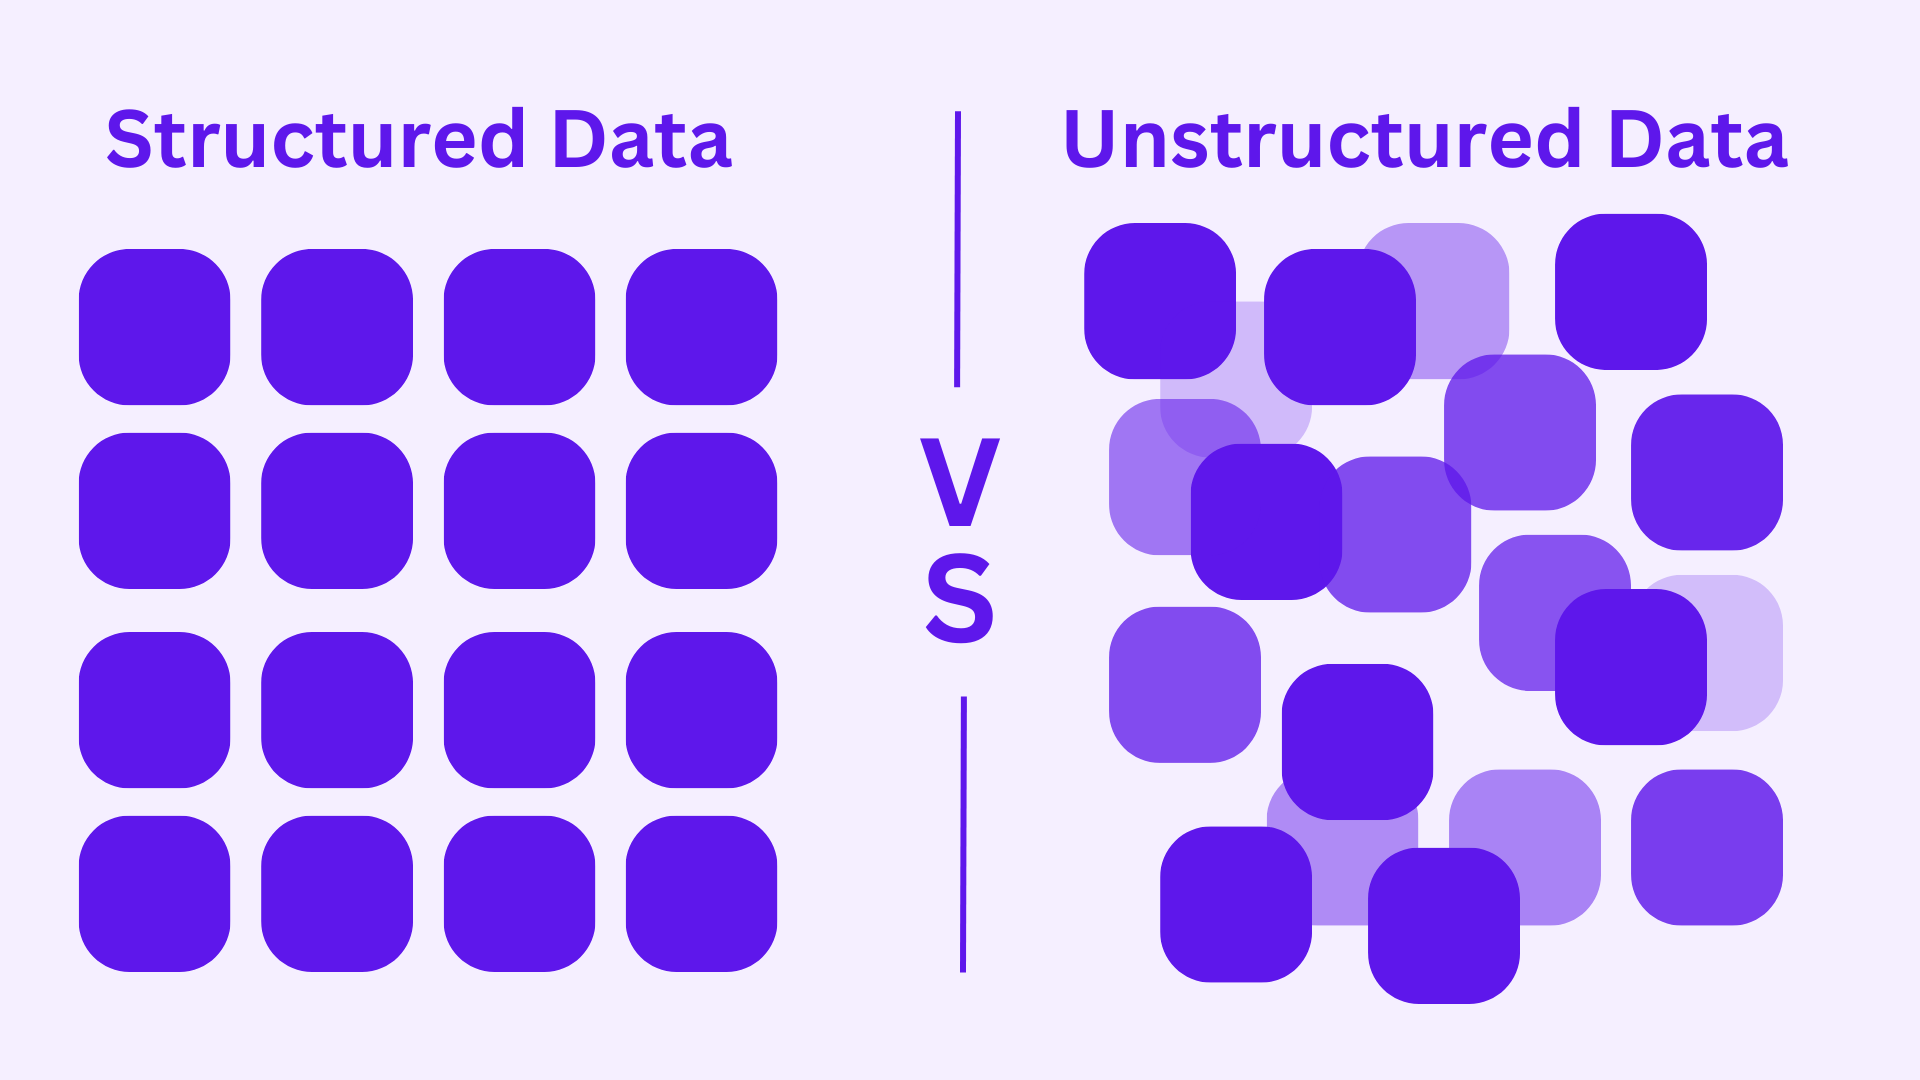
Structured data is data organized in a way that is easy to understand and use. It is usually stored in a database or spreadsheet and is characterized by a well-defined structure. Each data element is typically assigned a specific field or column in the schema, and each record or row represents a specific instance of that data. 

Unstructured data, on the other hand, is data that does not have a predetermined structure. It can be text, images, audio or video and can be found in many different formats. Unstructured data is often more difficult to understand and use than structured data. 

Here are some examples of structured data. 

Customer Information: This information may include the customer’s name, address, phone number, email address and purchase history. 

Product Listing: This information may include product name, description, price and images. 

Financial Information: This information may include the company’s balance sheet, income statement and cash flow statement. 

Sensor Data: This data may include temperature, humidity and pressure sensors. 

Social Media Data: This data may include the number of followers, likes and shares of a particular post. Here are some examples of unstructured data. 

Text documents: This information can include books, articles, emails and social media posts. Images: This information may include photos, videos and paintings. Audio: This data may include music, podcasts and speech. 

Video: This information may include movies, TV shows, and live streams. 

Structured data is often used in applications such as: 

Data analysis: Structured data can be easily analyzed to identify trends and patterns. Machine learning: Structured data can be used to predict machine learning models. 

Data visualization: Structured data can be used to create charts and graphs to help people understand the data. 

Search Engines: Structured data can be used to help search engines index and understand website content. 

Unstructured data is often used in applications such as: 

Natural Language Processing: Unstructured data can be used to extract meaning from text and other unstructured data. 

Image Recognition: Unstructured data can be used to identify objects and scenes in images. 

Speech Recognition: Unstructured data can be used to transcribe speech into text. 

Machine translation: Unstructured data can be used to translate text from one language to another. The main difference between structured data and unstructured data is the way they are organized. 

Structured data is organized in a predefined way, while unstructured data is not. This makes structured data easier to understand and use, but can also be more difficult to create and maintain. Unstructured data is more difficult to understand and use, but can be more flexible and can be used to represent a wider range of information. The best data to use for a particular application depends on the specific requirements of the application. If an application requires easy data analysis and processing, structured data is a good choice. If an application requires the ability to represent a variety of data, unstructured data is a good choice. In recent years, the use of unstructured data has increased. This is due to the increasing availability of unstructured data and the development of new technologies that can be used to analyze and process unstructured data. As a result, unstructured data is becoming increasingly important in many different applications. 

Structured data is usually stored in a database or spreadsheet and is characterized by a well-defined structure. Each data element is typically assigned a specific field or column in the schema, and each record or row represents a specific instance of that data. For example, a customer record might have fields for the customer’s name, address, phone number, email address, and purchase history. 

Unstructured data has no predefined structure. It can be text, images, audio or video and can be found in many different formats. A text document can be, for example, a book, article, email or social media message. The image can be a photo, painting or screenshot. An audio file can be a song, a podcast or a speech. A video file can be a movie, TV show, or stream. 

Here are some other key differences between structured data and unstructured data. 

Data: Structured data usually has a fixed set of data types for each field. For example, a customer record might have the fields customer name (string), address (string), phone number (integer), email address (string), and purchase history (date). Unstructured data does not have a fixed set of data types and the data can be of any type. 

Amount of data: Structured data is usually smaller than unstructured data. This is because structured data is organized in such a way that it is easy to store and retrieve. Unstructured data is often larger because it is not organized in a predetermined way. 

Data processing: structured data is generally easier to process than unstructured data. This is because structured data is organized in a way that is easy to understand and process. Unstructured data is more difficult to process because it is not organized in a predetermined way. 

Data analysis: structured data is generally easier to analyze than unstructured data. This is because structured data is organized in a way that makes it easier to identify patterns and trends. Unstructured data is more difficult to analyze because it is not organized in a predetermined way. 

The best data to use for a particular application depends on the specific requirements of the application. If an application requires easy data analysis and processing, structured data is a good choice. If an application requires the ability to represent a variety of data, unstructured data is a good choice. 

In recent years, the use of unstructured data has increased. This is due to the increasing availability of unstructured data and the development of new analysis techniques.