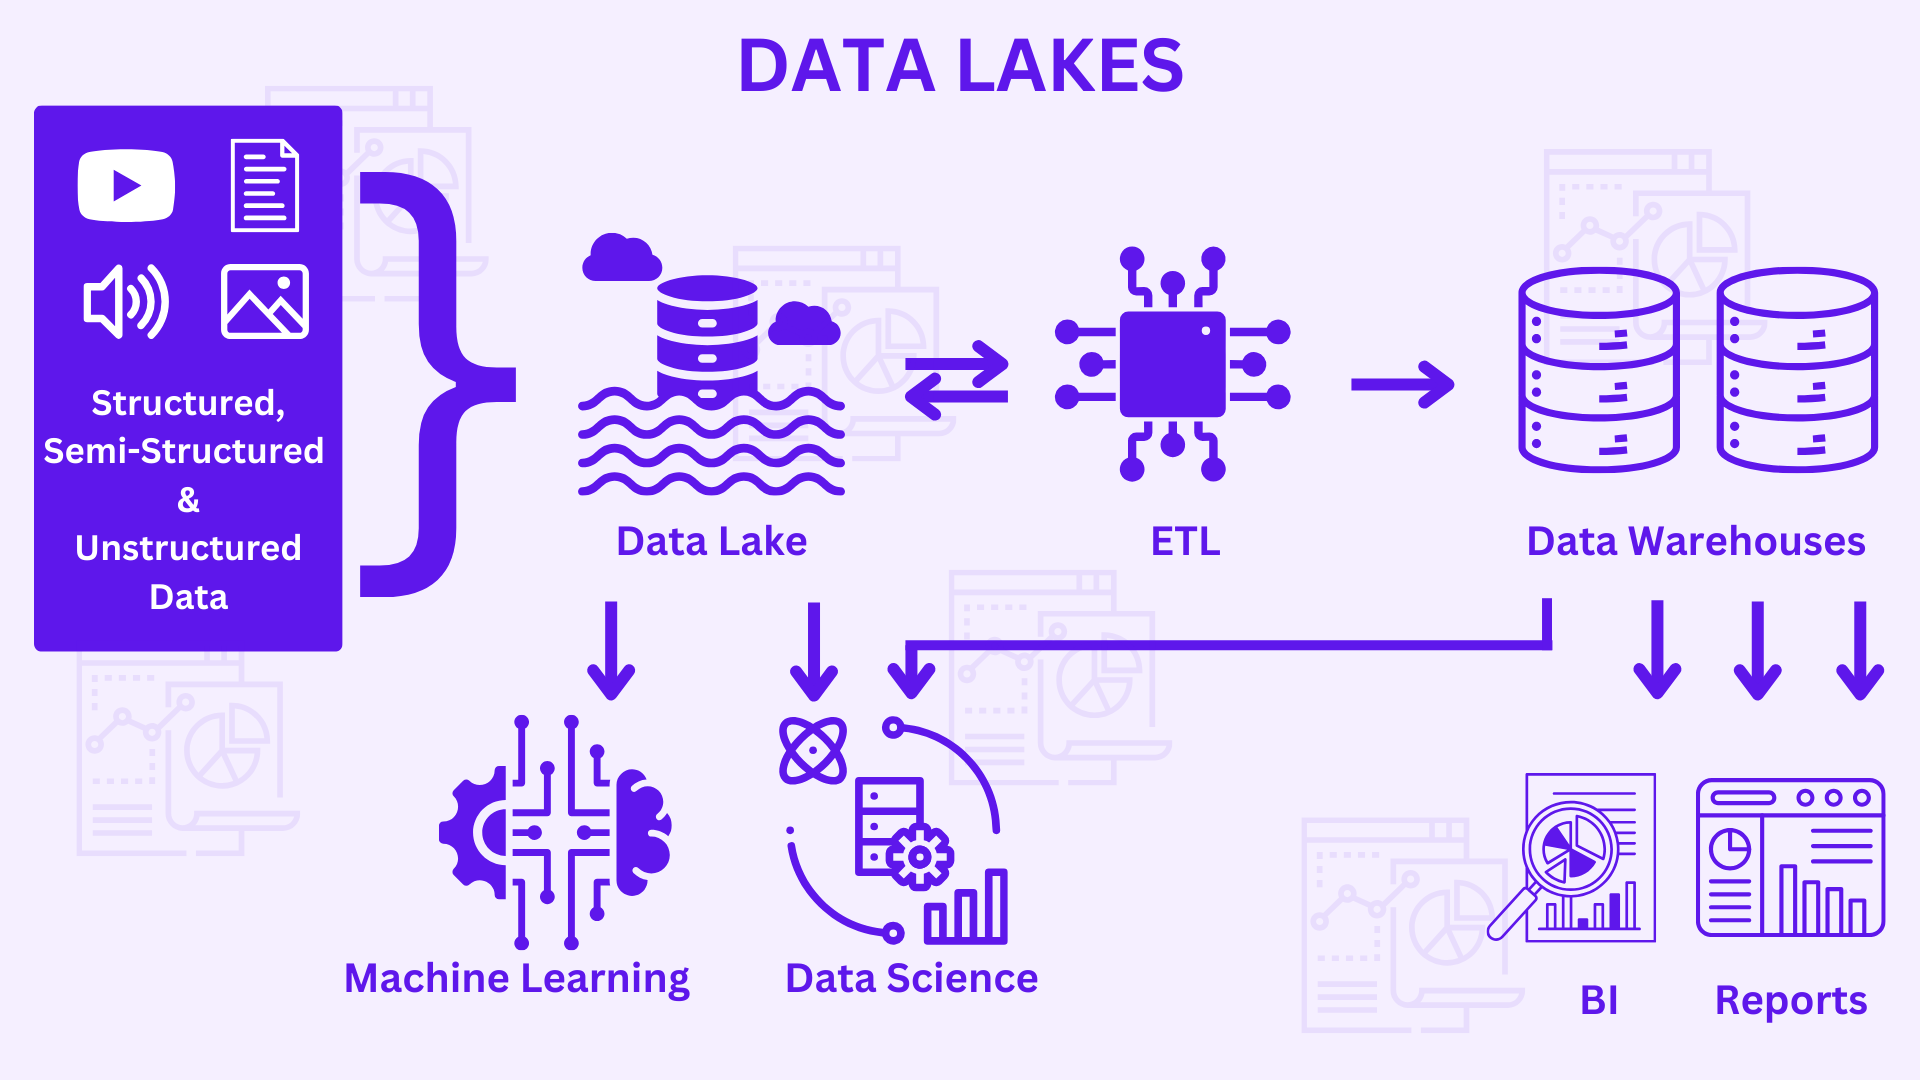
Data Lakes are a centralised repository of raw data & has the ability to store structured, semi-structured and...
Read More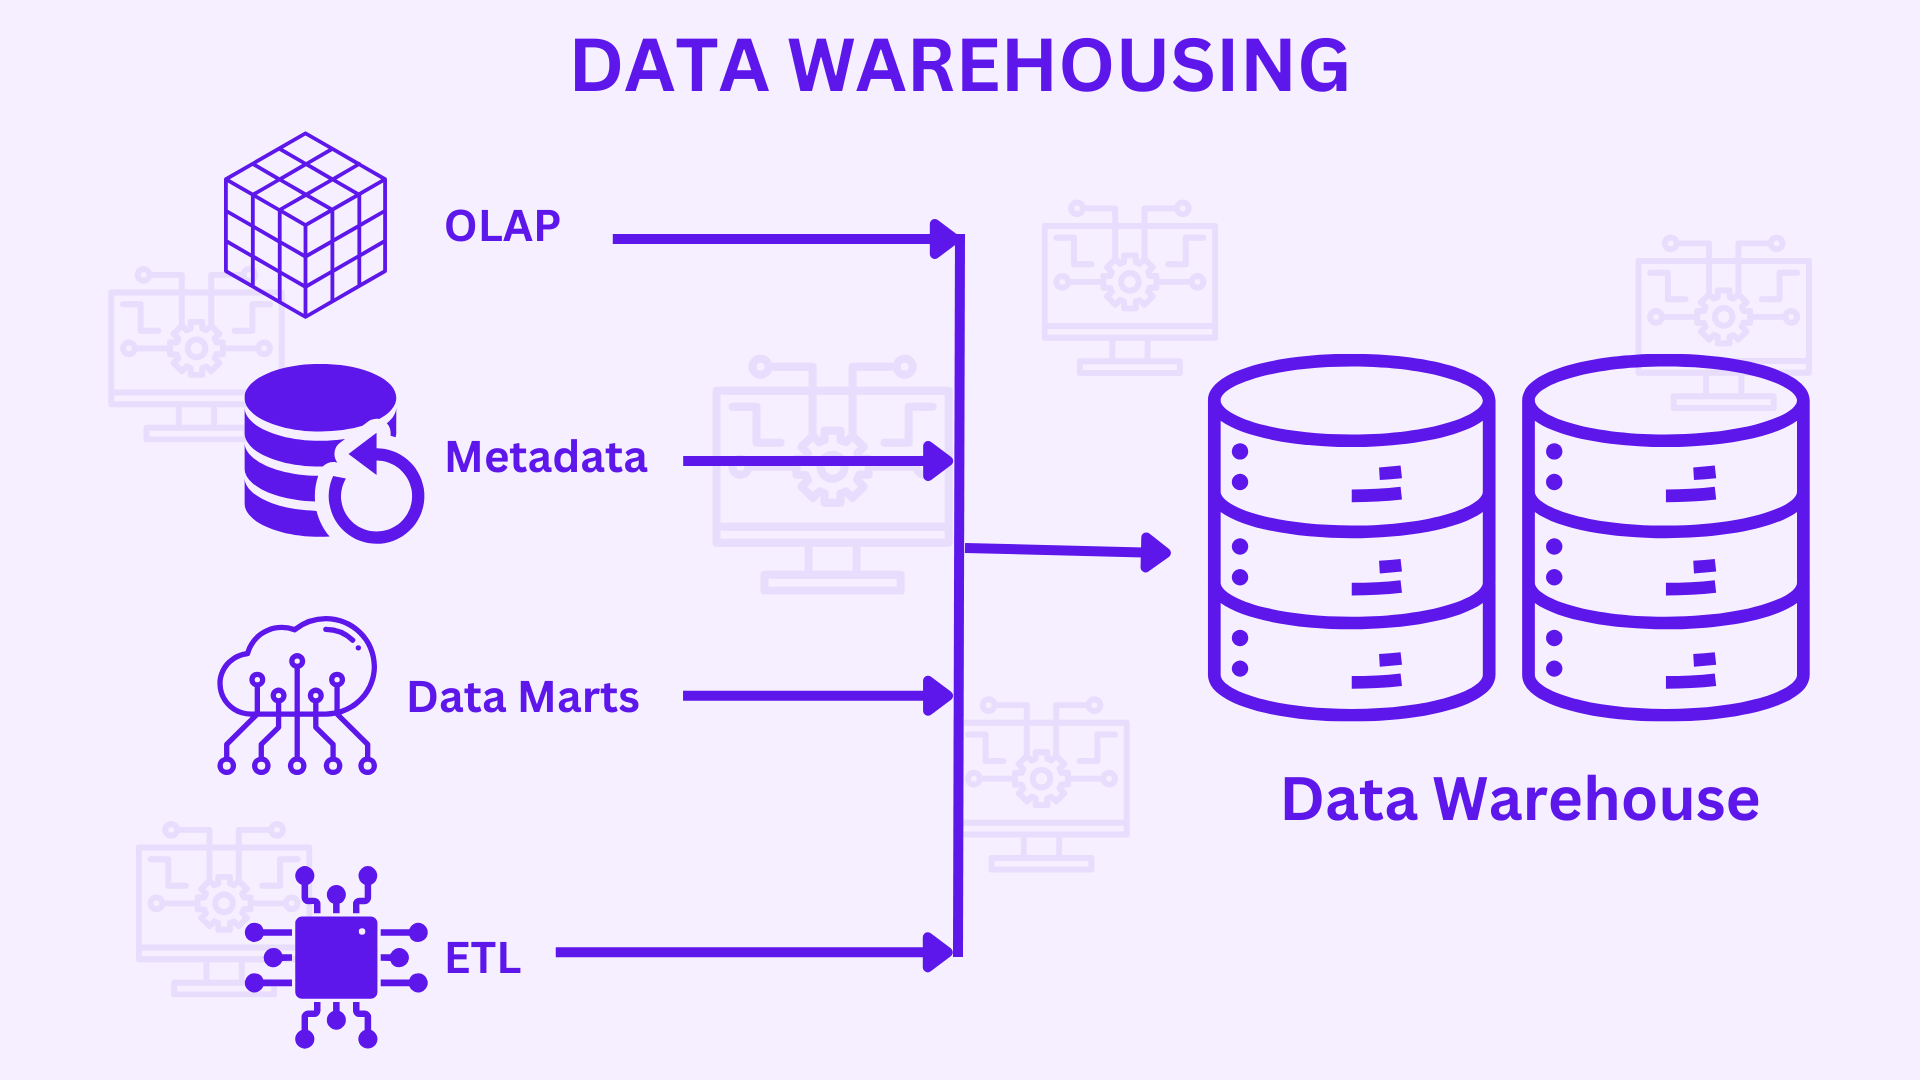
Data Warehouses
Data Warehouses are a central repository for data that has been merged from one or more diverse sources....
Read MoreOLTP – Online Transaction Processing
Online transaction processing (OLTP) is a type of database system used in transaction-oriented applications, such as many operational...
Read More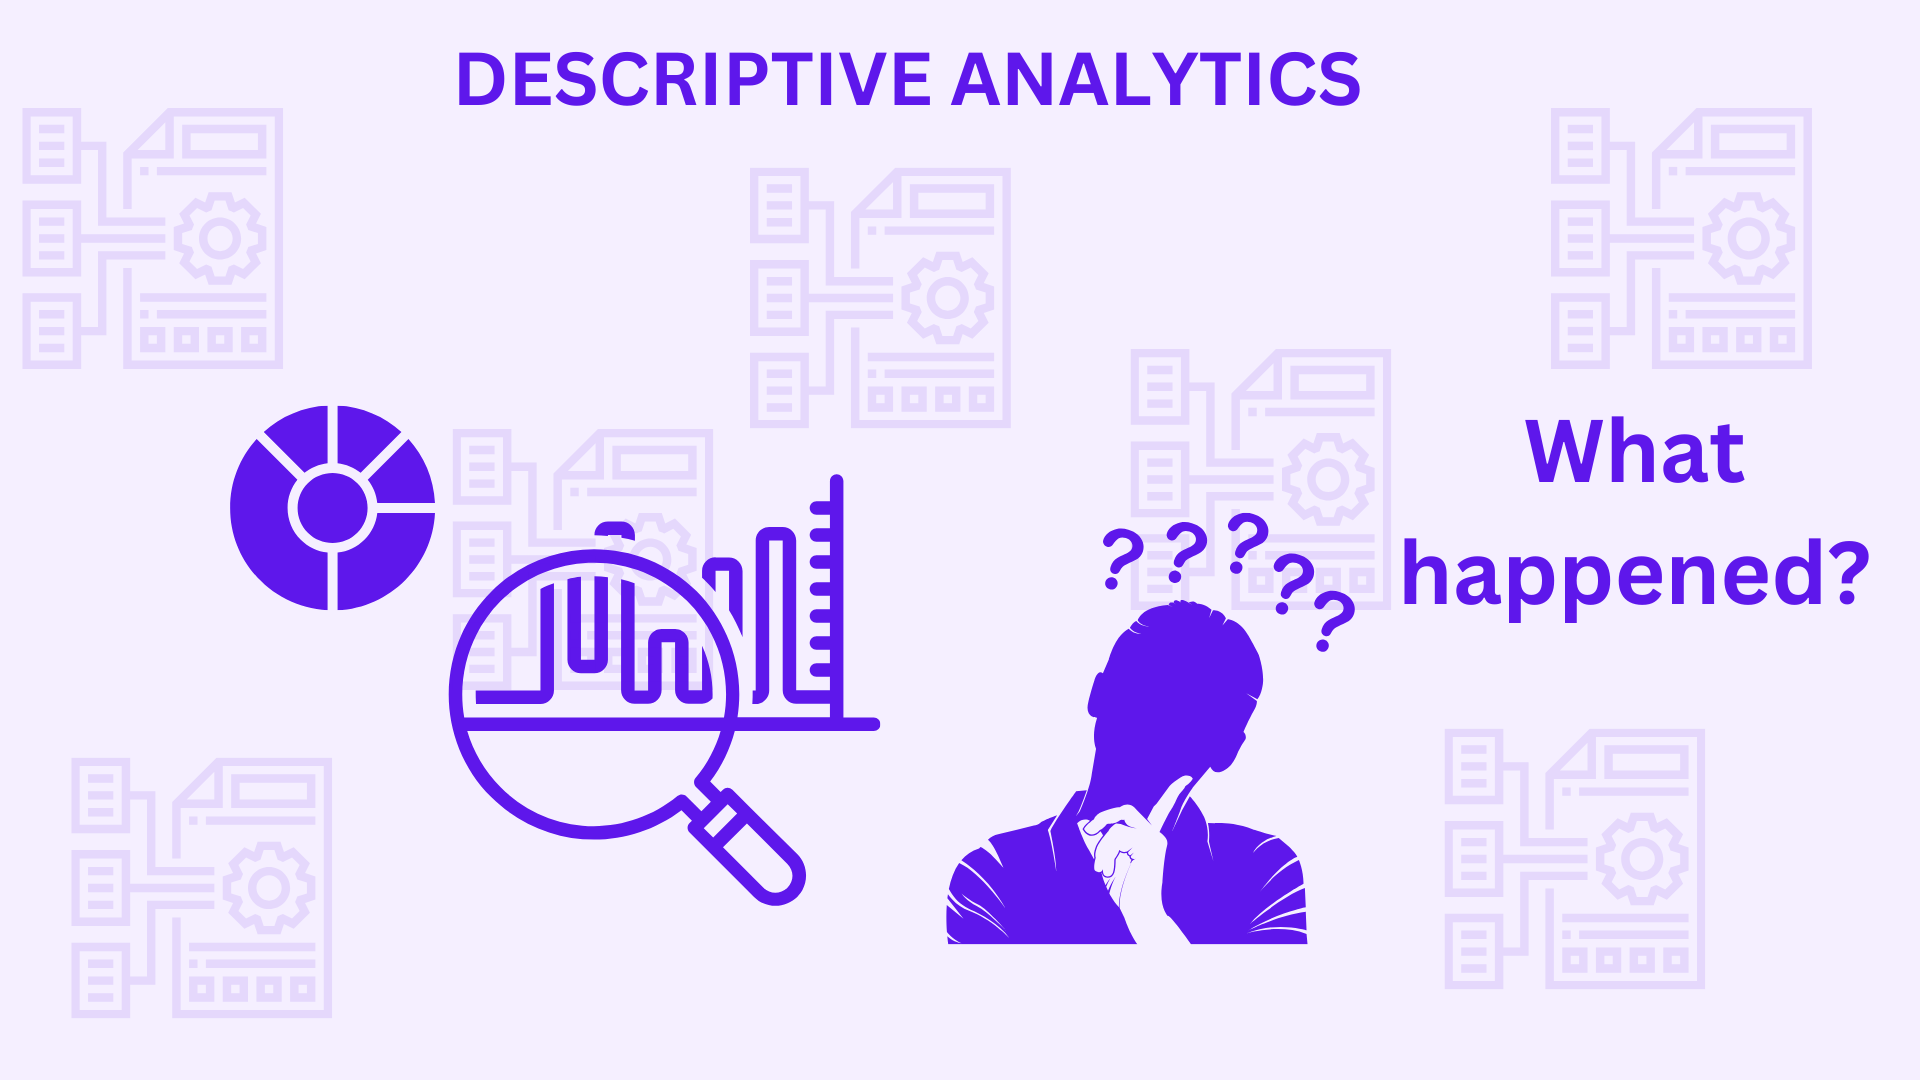
Descriptive Analytics
Descriptive Analytics helps us describe what things look like or what happened in the past. It can take...
Read More
Information-Action Value Chain
The information-action value chain is a framework that helps organizations understand how information can be used to create...
Read More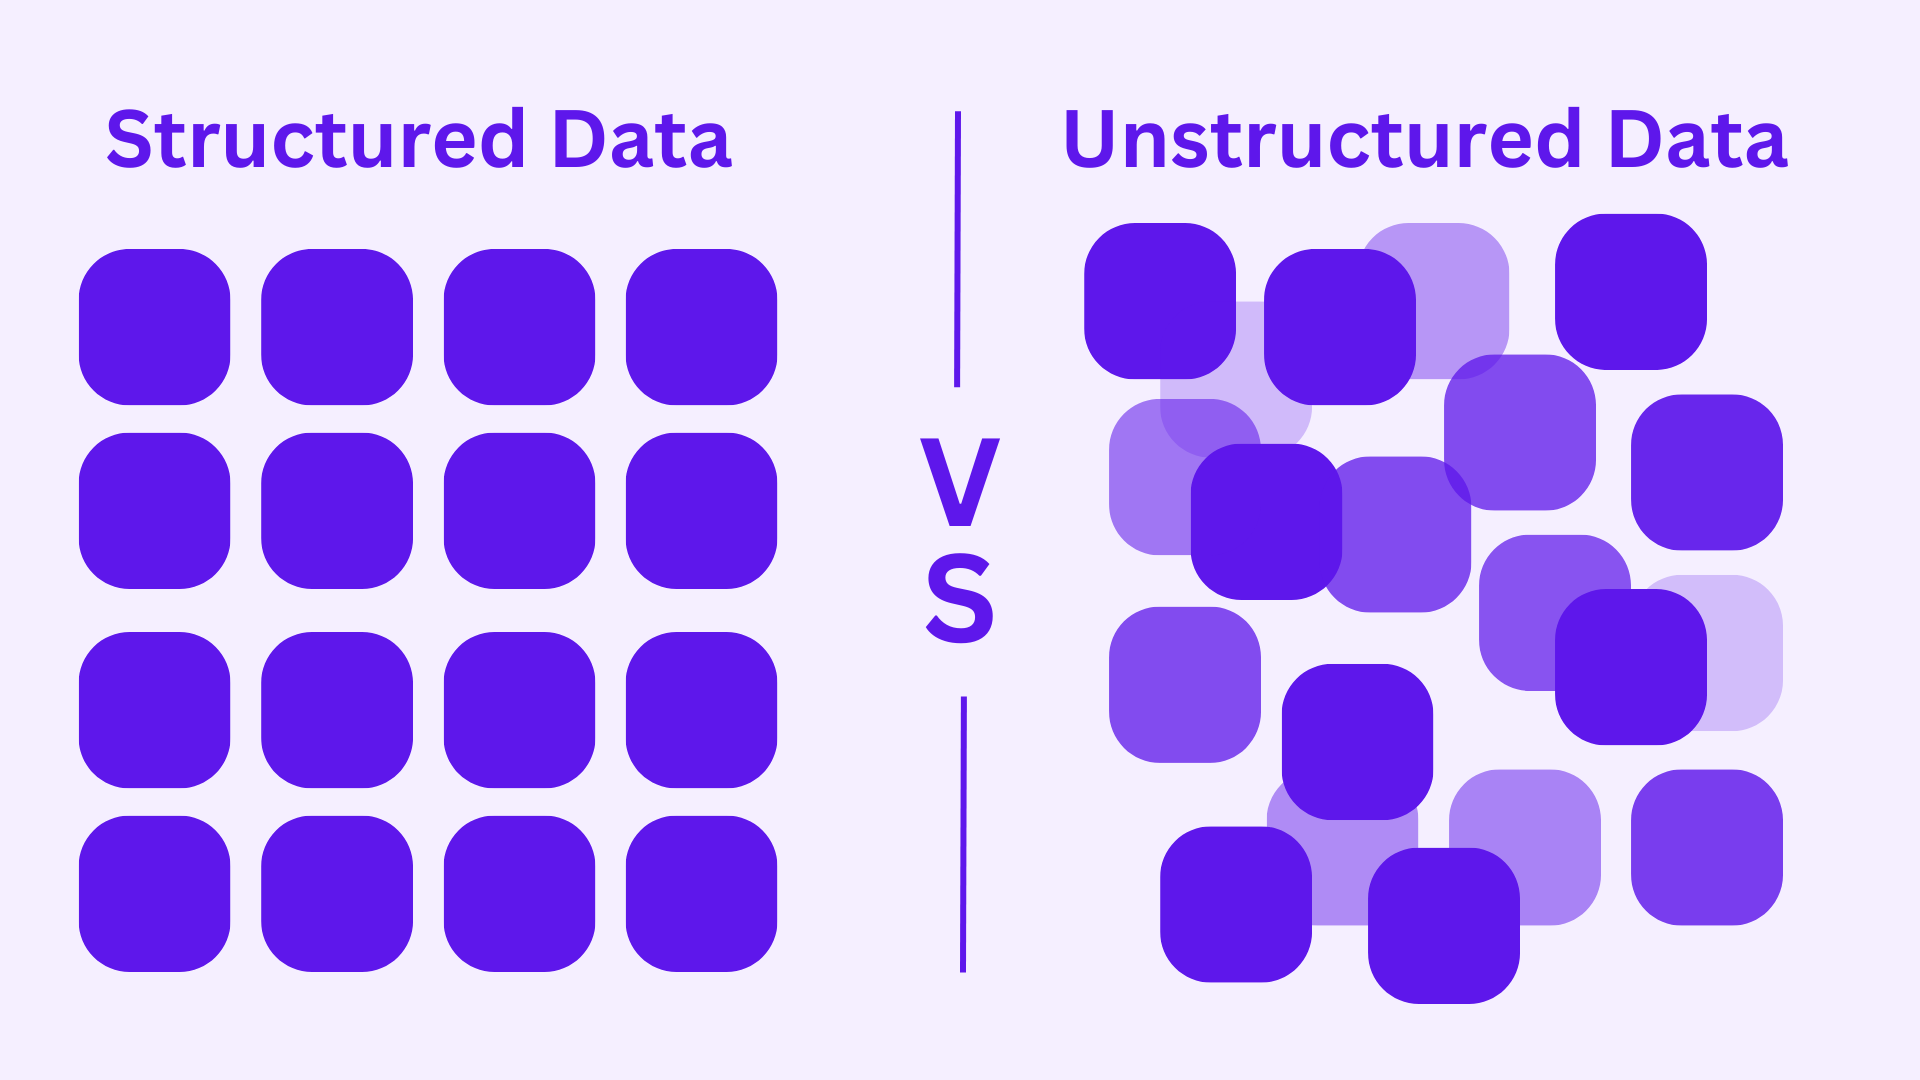
Structured Data & Unstructured Data
Structured data and unstructured data are two types of data commonly used in the field of data science. The...
Read More