Naveen Chandra

OLAP | Online Analytical Processing

Online analytical processing (OLAP) is an analytical technology that organizes large business databases and supports complex analysis. It is used to perform complex analytical queries without negatively affecting transactional systems.

The databases that a business uses to store all its transactions and records are called online transaction processing (OLTP) databases. These databases usually have records that are entered one at a time. The databases that are used for OLTP, however, were not designed for analysis.

OLAP systems were designed to help extract this business intelligence information from the data in a highly performant way. This is because OLAP databases are optimized for heavy read, low write workloads.

OLAP combines and groups this data into categories to provide actionable insights for strategic planning.

Why is OLAP important?

Online analytical processing (OLAP) helps organizations process and benefit from a growing amount of digital information. Some benefits of OLAP include the following:

  • Faster decision making – Businesses use OLAP to make quick and accurate decisions to remain competitive in a fast-moving economy. Performing analytical queries on multiple relational databases is time consuming & lengthy because the computer system searches through multiple data tables. On the other hand, OLAP systems pre calculates and integrates data so business analysts can generate reports faster when needed.
  • Non-technical user support – OLAP systems make complex data analysis easier for non-technical business users. Business users can create complex analytical calculations and generate reports instead of learning how to operate databases.
  • Integrated data view – OLAP provides a unified platform for marketing, finance, production, and other business units. Managers and decision makers can see the bigger picture and effectively solve problems. They can perform what-if analysis, which shows the impact of decisions taken by one department on other areas of the business.

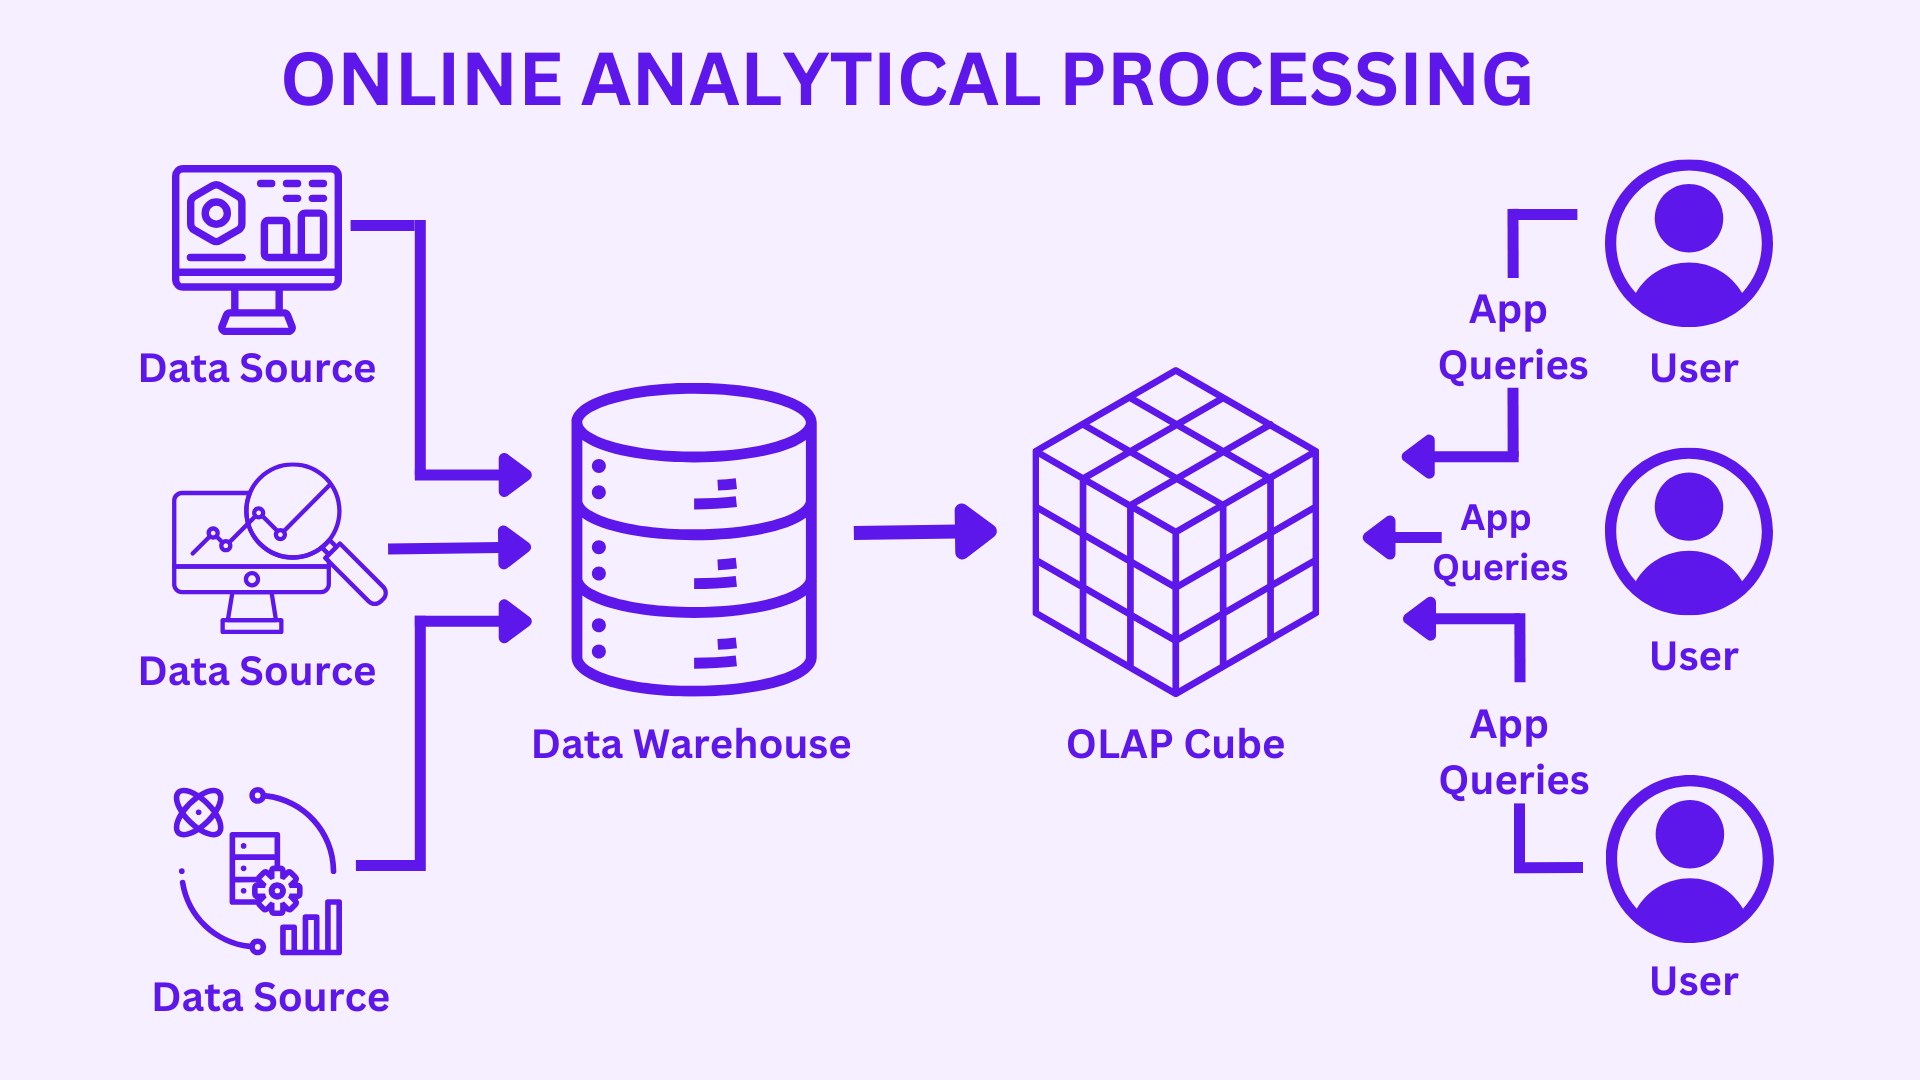
Data engineers build a multidimensional OLAP system that consists of the following elements:

  • Data warehouse – A data warehouse collects information from different sources, including applications, files, and databases. It processes the information using various tools so that the data is ready for analytical purposes.
  • ETL tools – Extract, transform, and load (ETL) tools are database processes that automatically retrieve, change, and prepare the data to a format fit for analytical purposes. Data warehouses uses ETL to convert and standardize information from various sources before making it available to OLAP tools.

Read more about ETL in my detailed blog here.

  • OLAP server – An OLAP server is the underlying machine that powers the OLAP system. It uses ETL tools to transform information in the relational databases and prepare them for OLAP operations.
  • OLAP database – An OLAP database is a separate database that connects to the data warehouse. Data engineers sometimes use an OLAP database to prevent the data warehouse from being burdened by OLAP analysis. They also use an OLAP database to make it easier to create OLAP data models.
  • OLAP cubes – A data cube is a model representing a multidimensional array of information. While it is easier to visualize it as a three-dimensional data model, most data cubes have more than three dimensions. An OLAP cube, or hypercube, is the term for data cubes in an OLAP system. OLAP cubes are rigid because you cannot change the dimensions and underlying data once you model it.
  • OLAP analytic tools – Business analysts use OLAP tools to interact with the OLAP cube. They perform operations such as slicing, dicing, and pivoting to gain deeper insights into specific information within the OLAP cube. Popular OLAP analytical tools include Apache Kylin, IBM Cognos, Essbase etc.

Types of OLAP

Online analytical processing (OLAP) systems operate in three main ways:

MOLAP – Multidimensional online analytical processing (MOLAP) involves creating a data cube that represents multidimensional data from a data warehouse. Data engineers use MOLAP because this type of OLAP technology provides fast analysis.

ROLAP – Relational online analytical processing (ROLAP) allows data engineers to perform multidimensional data analysis on a relational database. ROLAP is suitable for analysing extensive and detailed data.

HOLAP – Hybrid online analytical processing (HOLAP) combines MOLAP and ROLAP to provide the best of both architectures. HOLAP allows data engineers to quickly retrieve analytical results from a data cube and extract detailed information from relational databases.

For all the benefits OLAP systems provide, they do produce a few challenges:

  • Whereas data in OLTP systems is constantly updated through transactions flowing in from various sources, OLAP data stores are typically refreshed at a much slower intervals, depending on business needs. This means OLAP systems are better suited for strategic business decisions, rather than immediate responses to changes. Also, some level of data cleansing and orchestration needs to be planned to keep the OLAP data stores up to date.
  • Unlike traditional, normalized, relational tables found in OLTP systems, OLAP data models tend to be multidimensional. This makes it difficult or impossible to directly map to entity-relationship or object-oriented models, where each attribute is mapped to one column. Instead, OLAP systems typically use a star or snowflake schema in place of traditional normalization.

Consider OLAP in the following scenarios:

  • Providing business users simpler way to generate reports from data present in data warehouse.
  • Providing several aggregations that will allow users to get proper consistent results.

OLAP is especially useful for applying aggregate calculations over large amounts of data. OLAP systems are optimized for read-heavy scenarios, such as analytics and business intelligence. 

OLAP allows users to segment multi-dimensional data into slices that can be viewed in two dimensions (such as a pivot table) or filter the data by specific values. This process is sometimes called “slicing and dicing” the data and can be done regardless of whether the data is partitioned across several data sources. This helps users to find trends, spot patterns, and explore the data without having to know the details of traditional data analysis.

OLTP | Online Transaction Processing

  • The management of transactional data using computer systems is referred to as online transaction processing (OLTP). OLTP systems record business interactions as they occur in the day-to-day operation of the organization, and support querying of this data to make inferences.

OLTP used to be restricted in the past to transactions taking place in the real world where something was traded, such as money, goods, information, requests for services, etc.

But throughout time, particularly with the invention of the internet, the definition of a transaction has been broadened to include any type of digital interaction or engagement with a company that may be initiated from any location in the world and via any web-connected sensor. It also includes any type of interaction or action that may be important for a company to record in order to better serve their consumers, such as watching a certain video, downloading PDFs from a website, or leaving comments on social media platforms.

Transactional data is information that tracks the interactions related to an organization’s activities. These interactions are typically business transactions, such as payments received from customers, payments made to suppliers, products moving through inventory, orders taken, or services delivered.


Implementing and using an OLTP system can create a few challenges:

  • OLTP systems are not always good for handling aggregates over large amounts of data, although there are exceptions, such as a well-planned SQL Server-based solution.
  • OLTP systems can be slow to execute and can cause a slow-down by blocking other transactions in the database.

We should use OLTP solutions when:

  • we need to efficiently process and store business transactions and immediately make them available to client applications in a consistent way.
  • any tangible delay in processing would have a negative impact on the day-to-day operations of the business.

OLTP systems are designed to efficiently process and store transactions, as well as query transactional data.

The goal of efficiently processing and storing individual transactions by an OLTP system is partly accomplished by data normalization — that is, breaking the data up into smaller chunks that are less redundant.

This supports efficiency because it enables the OLTP system to process large numbers of transactions independently, and avoids extra processing needed to maintain data integrity in the presence of redundant data.


Descriptive Analytics

Descriptive analytics can be defined as the most common, fundamental form of business analytics used to monitor trends and keep track of operational performance by summarizing and highlighting patterns in the past and existing data.

Descriptive analytics can be applied to a wide variety of everyday operational activities of a business. Reports on inventory, various workflows, sales figures, and revenue statistics are all based on descriptive analytics. Together, these reports offer a company a historical overview of its operations.

Descriptive analytics is the first step in the analytics method process, and it provides the foundation for more advanced analytics, such as predictive analytics, and prescriptive analytics.

Some common descriptive analytics techniques include:

  • Data mining: This involves using statistical and machine learning algorithms to identify patterns and trends in data.
  • Data visualization: This involves using charts, graphs, and other visual representations to make data easier to understand.
  • Reporting: This involves generating reports that summarize the findings of descriptive analytics.

Businesses of all sizes and sectors can benefit from descriptive analytics. It can assist firms in better understanding their customers, goods, and processes. This data can then be used to make better marketing, sales, product development, and operational decisions.

So, Descriptive analytics is a strong method for gaining insights from data. Businesses can make better decisions regarding the future if they understand what has happened in the past.

Predictive Analytics

Predictive analytics is a sort of data analytics that identifies patterns in data and predicts future outcomes using statistical, machine learning, and artificial intelligence (AI) approaches. It is a strong tool for making better judgements in a variety of business applications.

Types of Predictive Analytical Models:

Predictive analytics models are designed to assess historical data, discover patterns, observe trends, and use that information to predict future trends. Popular predictive analytics models include classification, clustering, and time series models.

Classification models – Classification models fall under the branch of supervised machine learning models. These models categorize data based on historical data, describing relationships within a given dataset. It can also be used to answer binary questions, such as yes or no or true or false; prominent applications include fraud detection and credit risk assessment. Logistic regression, decision trees, random forest, neural networks, and Nave Bayes are examples of categorization models.

Clustering model – Clustering Model is an example of unsupervised learning. They categorize data based on similarities. An e-commerce site, for example, can use the model to divide clients into similar groups based on shared characteristics and build marketing strategies for each group. Clustering algorithms that are commonly used include k-means clustering, mean-shift clustering and hierarchical clustering.

Time Series Model – Time series models incorporate a variety of data inputs at different time intervals, such as daily, weekly, monthly, and so on. The dependent variable is commonly plotted across time to examine the data for seasonality, trends and cyclical behavior, which may indicate the necessity for specific transformations and model types. Time series models that are commonly employed include autoregressive (AR), moving average (MA), Autoregressive Moving Average (ARMA) and Auto-Regressive Integrated Moving Average (ARIMA). A call centre, for example, can use a time series model to anticipate how many calls it will receive per hour at various times of day.

Benefits of Predictive Analytical Models:

Security: Data security is an issue that must be addressed by every modern organization. Security is improved by combining automation and predictive analytics. Specific security procedures can be triggered by specific patterns associated with suspicious and anomalous end user behaviour.

Risk reduction: Most firms are attempting to minimize their risk profiles in addition to keeping data secure. For example, a credit provider can utilize data analytics to determine whether a customer is at a higher-than-average risk of default. Other businesses may use predictive analytics to determine whether their insurance coverage is appropriate.

Better decision making: Running a business necessitates making calculated decisions. Any expansion or addition to a product line, or any other type of growth, necessitates weighing the inherent risk against the potential outcome. Predictive analytics can provide knowledge to help inform decision-making and create a competitive advantage.

Prescriptive Analytics

Prescriptive analytics is a type of data analytics that examines historical performance and trends to determine what needs to be done in order to meet future objectives. Despite the obvious benefits, corporate leaders should be aware that prescriptive analytics has drawbacks of its own.

Prescriptive analytics is applied in many fields, including healthcare, finance, manufacturing, and retail. Prescriptive analytics can be used by a healthcare institution to recommend the best treatment plan for a patient, a financial institution to offer the best investment strategy or a manufacturing corporation to recommend the best production schedule.

How Prescriptive Analytics Works?

Prescriptive Analytics aims to answer the question, “How did we get here?” It uses artificial intelligence techniques like machine learning to understand and advance from the data it collects, evolving as it goes.

Machine learning enables the processing of massive amounts of data that are now available. When fresh or extra data becomes available, computer programming automatically change to make advantage of it, in a far faster and more complete procedure than human capacities could do.

Prescriptive Analytics works with predictive analytics, which involves the usage of statistics and modelling to forecast future performance based on current and past data. However, it goes a step further: It advises a future course of action based on the predictive analytics prediction of what is likely to happen.


Benefits of using prescriptive analytics:

Improved decision-making: Prescriptive analytics can help businesses to make better decisions by providing insights into the best course of action.

Increased efficiency: Prescriptive analytics can help businesses to automate tasks and optimize processes.

Reduced risk: Prescriptive analytics can help businesses to identify and mitigate risks.

Increased revenue: Prescriptive analytics can help businesses to increase sales and improve profitability.

Advantages of using Prescriptive Analytics:

Prescriptive analytics can break through the fog of current uncertainty and shifting conditions. It can aid in the prevention of fraud, the reduction of risk, the achievement of company objectives, and the creation of more loyal customers. When used correctly, it can assist organizations in making decisions based on extensively analyzed data rather than instinctively jumping to uninformed opinions.

Prescriptive analytics can simulate and show the probability of multiple outcomes, allowing organizations to better grasp the level of risk and uncertainty they face than relying on averages. It enables organizations to obtain a better knowledge of the possibility of worst-case outcomes and plan accordingly.

Disadvantages of using Prescriptive Analytics:

However, prescriptive analytics is not without flaws. Organizations can only be effective if they know what questions to ask and how to respond to the answers. As a result, it is only effective if its inputs are correct. If the input assumptions are incorrect, the output results will be incorrect.

This type of data analytics is only appropriate for short-term problems. This suggests that organizations should avoid using prescriptive analytics to make long-term decisions. This is because it becomes less trustworthy as more time is required.

Not all vendors of prescriptive analytics are created equal. As a result, organizations must carefully assess the technology and who supplies it. Some may bring genuine, measurable outcomes, whereas others promise enormous data but fail to deliver.