Naveen Chandra

Data Mart

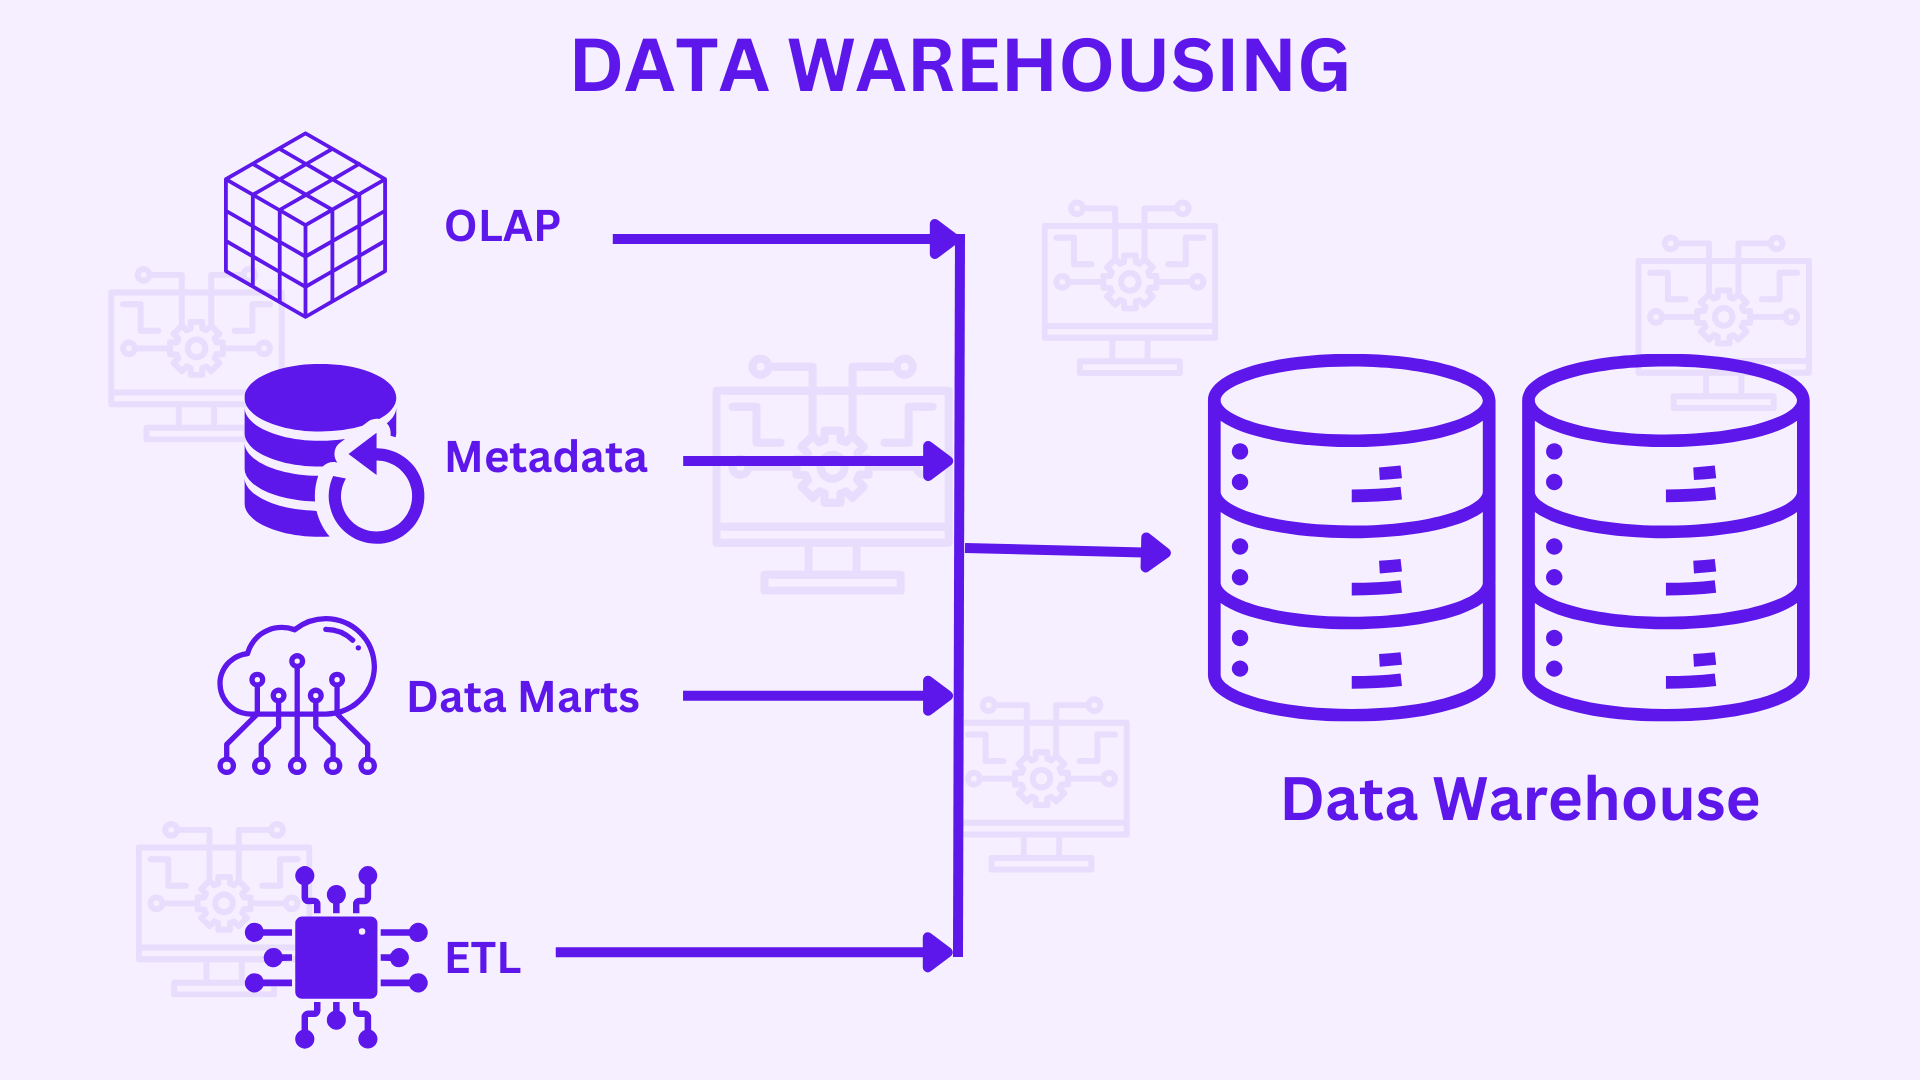
Data Marts are a subset of a data warehouse that is tailored to the needs of a particular business unit or department. Data marts often contain data important to a specific business area, such as sales, marketing, or finance. Data marts are frequently used to improve decision-making inside an organisation.

Reasons for creating a data mart
• Easy access to often needed data
• Easy to implement
• Lower cost than establishing a full data warehouse
• Potential customers are better defined than in a full data warehouse.
• It is less crowded and contains only necessary business data.

There are mainly two approaches of designing a data mart. These approaches are:
1. Dependent Data Marts
2. Independent Data Marts

Dependent Data Marts: Dependent data marts are logical subsets of physical subsets of a larger data warehouse. The data marts are considered as subsets of a data warehouse in this technique. This technique begins with the creation of a data warehouse, from which other data marts can be produced. These data marts rely on the data warehouse and retrieve the necessary records from it. There is no requirement for data mart integration in this technique because the data warehouse builds the data mart. It is also referred to as a top-down strategy.

Independent Data Marts: The second method is independent data marts (IDM). In this case, independent data marts are built initially, followed by the construction of a data warehouse based on these independent multiple data marts. Because each data mart is developed independently in this method, data mart integration is essential. It is also known as a bottom-up strategy since data marts are combined to create a data warehouse.

So, to summarise, data marts are formed from data warehouses, where warehouses are a vast repository of information whereas marts are just a subset of data warehouse. Data warehouses contain very detailed information about multiple subject areas, whereas marts contain very summarised data about a particular topic & is much project oriented.

Dashboarding & Visualisation

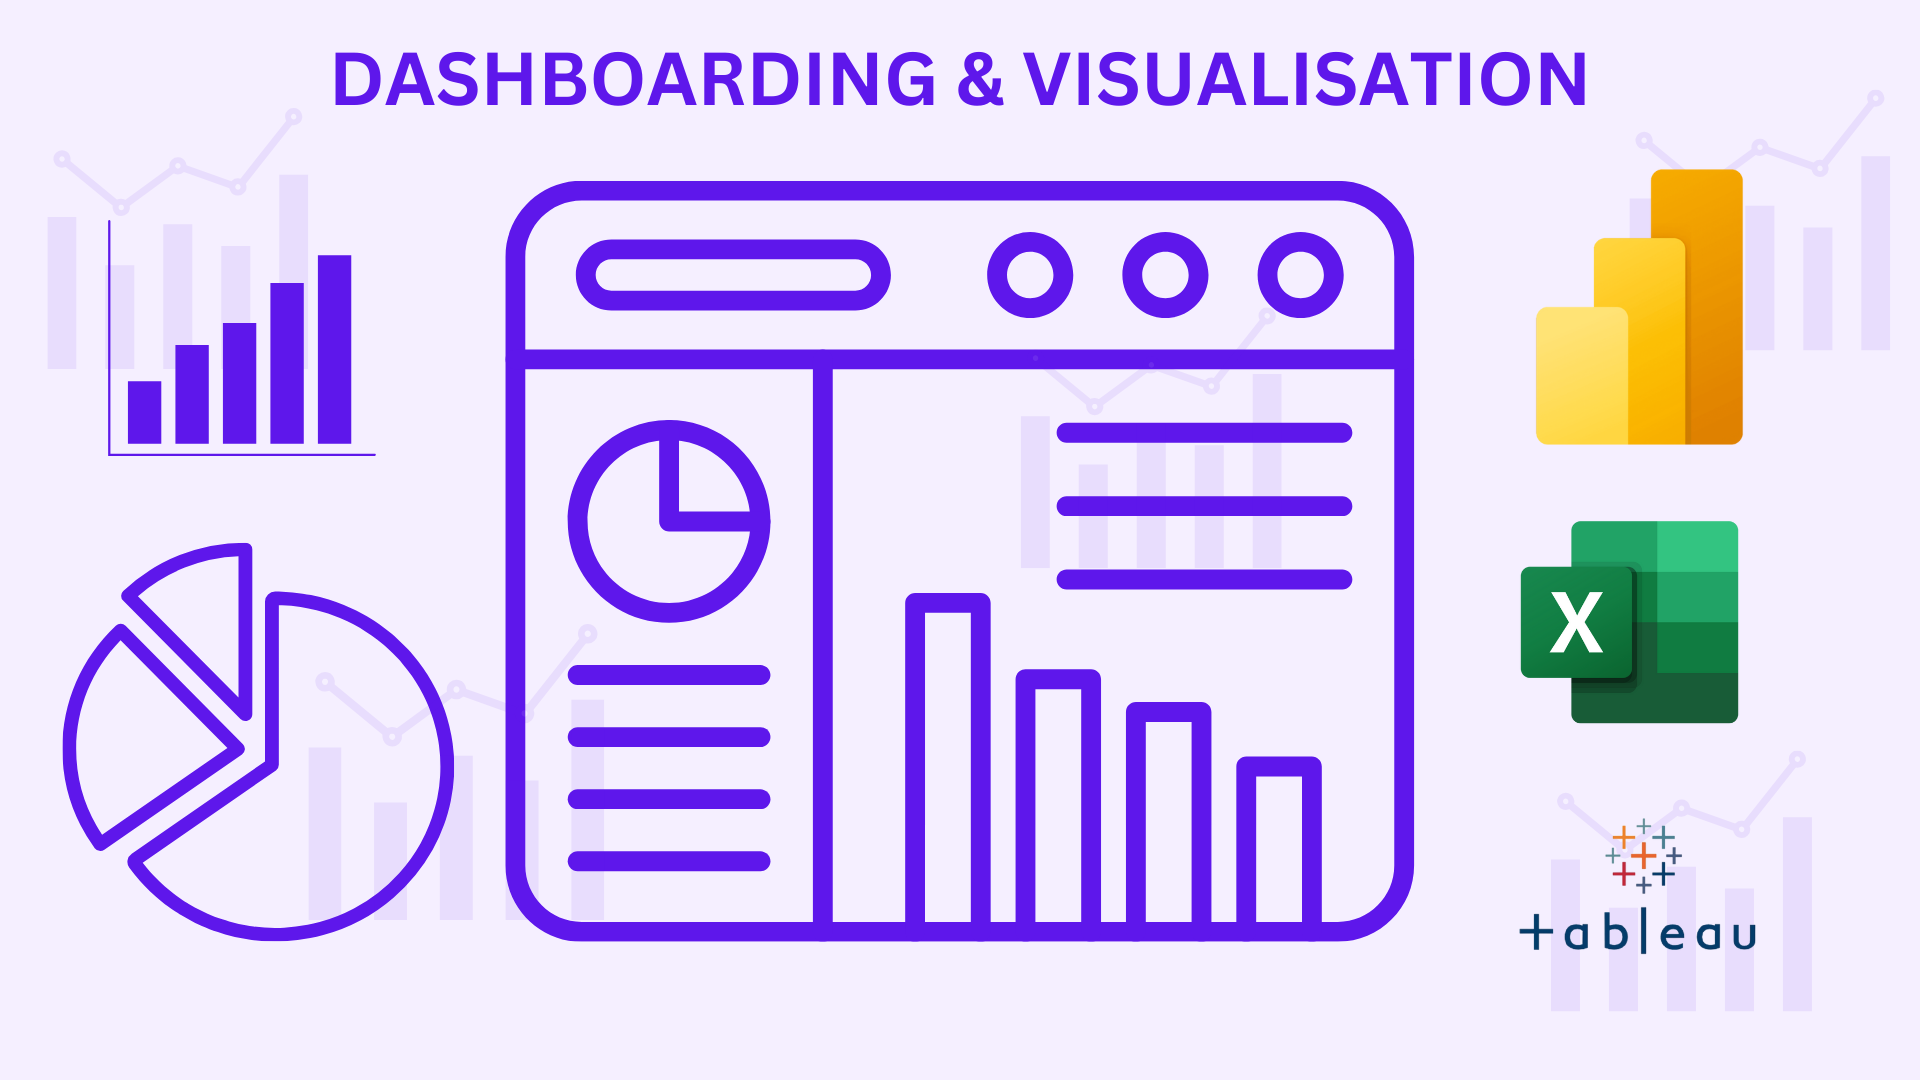
Visualization and dashboarding are two related concepts that are used to communicate data to audiences & stakeholders in a way that is easy to understand.

Data Visualisation: The process of expressing data in a visual manner, such as charts, graphs, or maps, is known as data visualisation. This can assist to make data more intelligible and entertaining, as well as discover patterns and trends that may not be obvious when looking at raw data.

Dashboarding: Dashboarding is the practise of developing a single interface that displays a variety of data visualisations in an easy-to-scan and interpret format. Dashboards are frequently used to measure key performance indicators (KPIs) and other metrics, and they can be used to monitor a company’s or organization’s performance.

Visualization and dashboarding are both important tools for data analysis and decision-making. By using these tools, organizations can make better sense of their data and take informed action.

Dashboards are also interactive making them extremely flexible tools that puts power in users’ hands. A dashboard doesn’t answer one question & then loses its usefulness, instead it can answer multiple questions based on what user is searching for and how it is used. Instead of building 10 separate charts to answer 10 questions, just one interactive dashboard does the job. Creating a dashboard that empowers users to interpret data on their own.

Types of dashboards
Strategic Dashboards – Strategic dashboards focuses on long term goals & strategies at the highest level of metrics. It usually contains information that is useful for enterprise-wide decision making.
Operational Dashboards – Operational Dashboards tracks short term performance and intermediate goals. It usually contains information on the time scale of days, months, or weeks, and they can provide performance insights almost in real time. Operational dashboards could focus on customer service team performance.
Analytical Dashboards – Analytical dashboards consist of the datasets and the mathematics used in the sets.
It contains details involved in the use, analysis and predictions made by data scientists. Data Science teams usually create and maintain most technical category as analytics dashboard.

Organising Dashboard Elements

  • Once charts are placed into dashboards, rearrangement should be done in a configuration that best suits the stakeholder needs.
  • Some placement decisions have been already been made during mock-up planning stage. Make sure to reference the low fidelity drafts when building visualisations.
  • Also consider previous discussions with stakeholders about their needs & relevant metrics & KPIs.

Best Design Practices To be Followed
1. Prioritisation & Hierarchy –
Items can be prioritised & can be done in hierarchical order by increasing size compared to other visualisations.
2. Grouping objects that show a topic or tell a story helps ensure that our dashboard has logical flow.
3. Hide objects – Organise visualisations on multiple pages or place them within drop down menus that hide parts of dashboard from main screen. By hiding some elements, we can spotlight others, avoid clutter without deleting content & even increase processing speed.
4. Don’t group objects based on chart type. Instead, objects should be organised by topic or metric.


Data Lakes

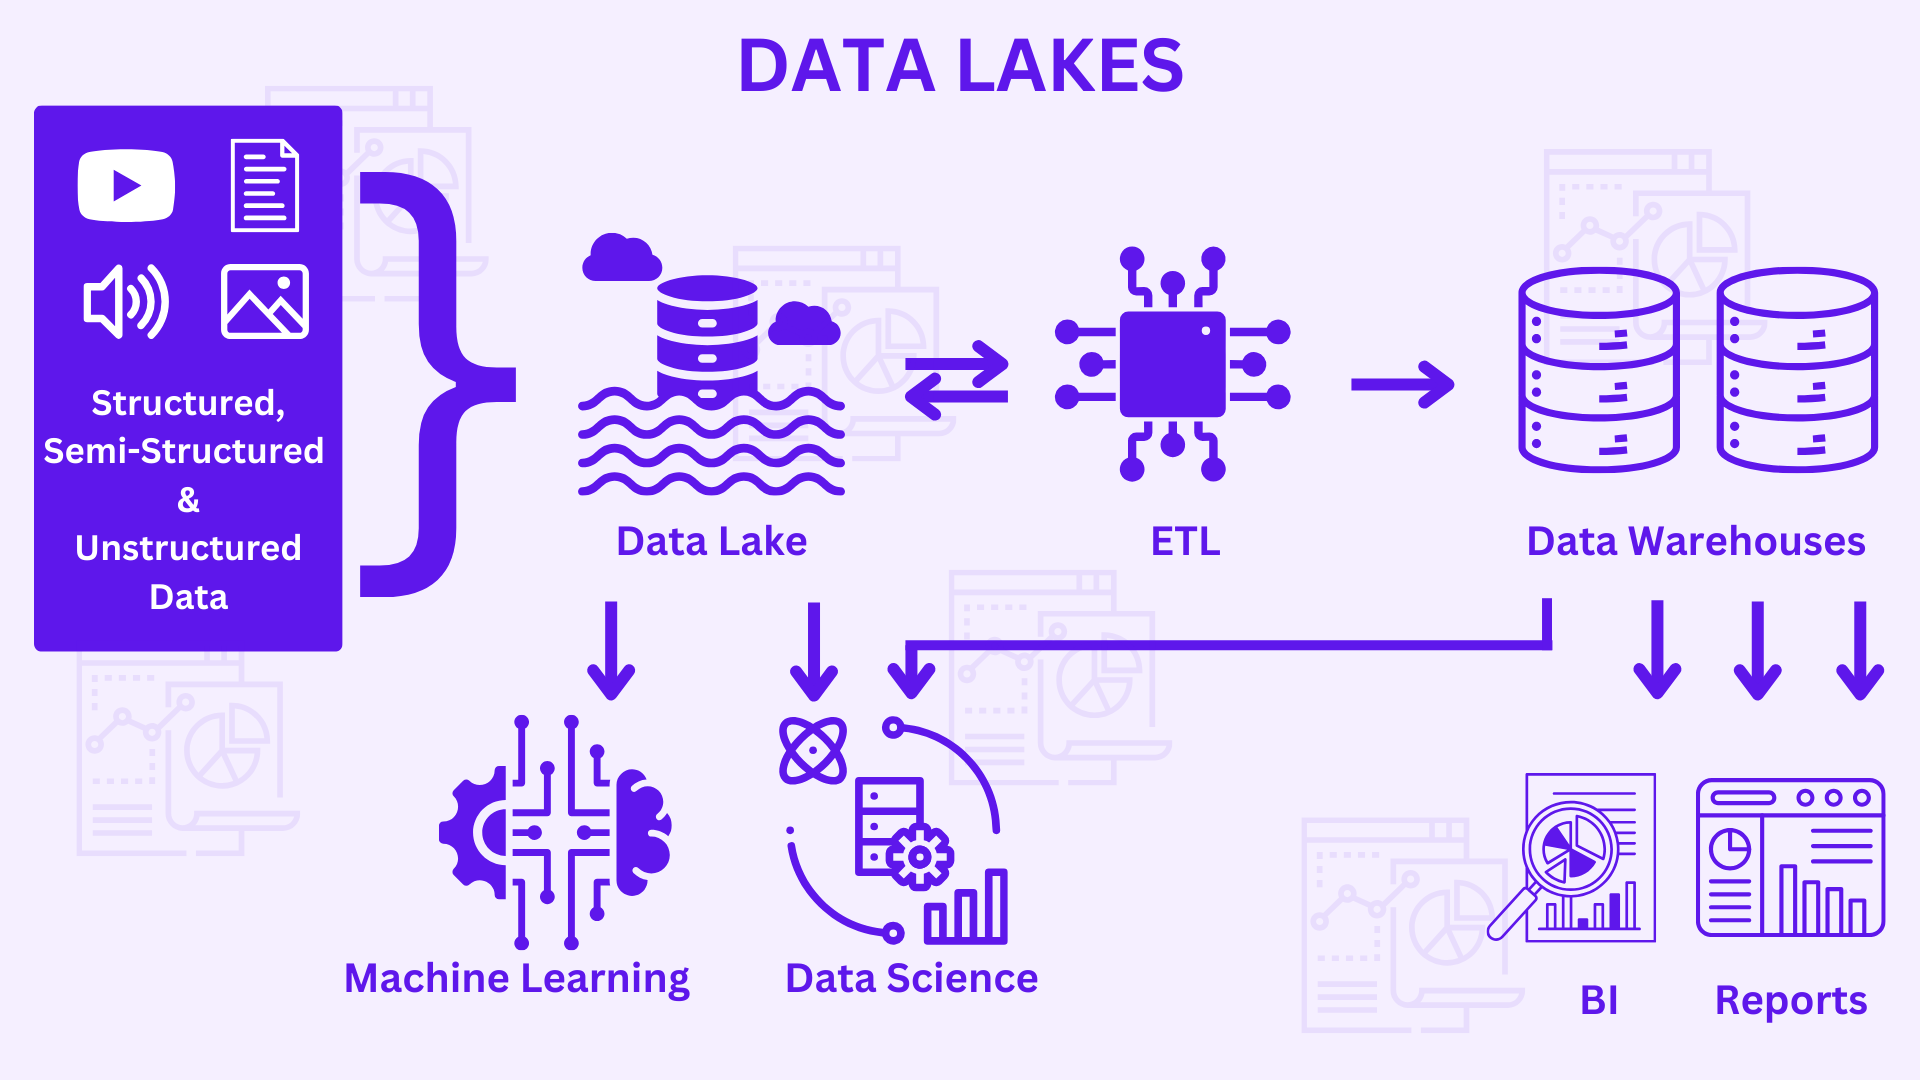
Data Lakes are a centralized repository that stores data in raw format. It can store structured, semi-structured and unstructured data. Data Lakes are only used to store the data that is not ready for analysis, and will be used to analyse the data in the future.

Advantages of Using a Data Lake

  • It is capable of storing enormous volumes of data in its native format without the need for pre-processing. This facilitates the storage and management of many sorts of data.
  • It can be used for data mining, machine learning, and business intelligence, among other things.
  • It can assist organisations in gaining insights from their data that standard data warehouses cannot provide.


Ability of using Data Lakes

Powers Data Science & Machine Learning: With low latency, data lakes enable you to turn raw data into structured data that is ready for SQL analytics, data science, and machine learning. Raw data can be kept indefinitely for future use in machine learning and analytics at a reasonable cost.

Centralizes & forms catalogue of data: A centralised data lake addresses the problems associated with data duplication, numerous security regulations, and collaboration challenges providing downstream users with a single location to search for all data sources.

Quick & seamless integration across diverse data sources: A data lake can collect and store any sort of data, including batch and streaming data, video, image, binary files, and more. Furthermore, because the data lake serves as a landing zone for fresh data, it is always up to date.


Challenges of using Data Lakes

Data Lake Complexity: Data lakes can be difficult and costly to manage. They frequently comprise a range of data kinds that might be challenging to integrate and analyse. Furthermore, data lakes can be incredibly big, making it difficult to identify and access the data you require.

Data Lake Security: If not properly managed, data lakes might pose a security concern. They frequently contain sensitive information, such as client PII, financial information, and intellectual property. This data may be subject to hacking and other harmful parties.

Data Lake Scalability: To accommodate the expanding volume and variety of data, data lakes must be scalable. As businesses generate more data, they must be able to store it in a data lake without affecting performance.


Data Warehouses

A data warehouse is a system that is used for data analysis and reporting. It is a central repository for data that has been merged from one or more diverse sources. Data warehouses are used to support BI activities like data mining, online analytical processing (OLAP), and business reporting.

The main characteristics of a data warehouse are:

  • It is a centralized repository of data.
  • The data is integrated from multiple sources.
  • The data is historical and time-series oriented.
  • The data is subject-oriented, meaning that it is organized around business entities such as customers, products, and orders.
  • The data is summarized and aggregated for analysis.

Examples of data warehouses include:

Customer relationship management (CRM) data warehouses: These warehouses store data about customers, such as their contact information, purchase history, and product preferences.

Supply chain management (SCM) data warehouses: These warehouses store data about suppliers, products, and inventory levels.

Financial data warehouses: These warehouses store data about financial transactions, such as sales, expenses, and profits.

Healthcare data warehouses: These warehouses store data about patients, such as their medical records, billing information, and insurance claims.


Data Warehouse Schemas

Schemas are ways in which data is organized within a database or data warehouse. There are two main types of schema structures, the star schema and the snowflake schema, which will impact the design of your data model:

Star Schema: The star schema is made up of one fact table that can be connected to a number of denormalized dimension tables. It is the most basic and widely used type of schema, and its users benefit from faster query speeds.

Snowflake Schema: While not as extensively used, the snowflake schema is another organisation structure in data warehouses. In this scenario, the fact table is linked to a number of normalised dimension tables, each of which dimension table has child tables. Snowflake schema users benefit from minimal levels of data redundancy. However, this benefit comes at a price of query performance.


Benefits of using Data Warehouses:

  • Improved data quality: A data warehouse consolidates data from various sources, including transactional systems, operational databases, and flat files. It then cleans it up, removes duplicates, and standardises information in order to create a single source of truth.
  • Quicker business insights: Decision makers’ capacity to define company strategy with certainty is limited by data from various sources. Data warehouses provide for data integration, allowing business users to include all of a company’s data into every business decision.
  • Smarter decision-making: A data warehouse facilitates large-scale BI functions such as data mining (the discovery of previously unseen patterns and relationships in data), artificial intelligence, and machine learning—tools that data professionals and business leaders can use to obtain hard evidence for making smarter decisions in virtually every area of the organisation, from business processes to financial management and inventory management.
  • Gaining and maintaining a competitive advantage: All of the aforementioned factors work together to assist an organisation in discovering more opportunities in data faster than is achievable with disjointed data stores.

ETL vs ELT

ETL and ELT are two data integration methodologies that are used to extract data from different sources, transform it into a consistent format, and load it into a data warehouse or data lake.

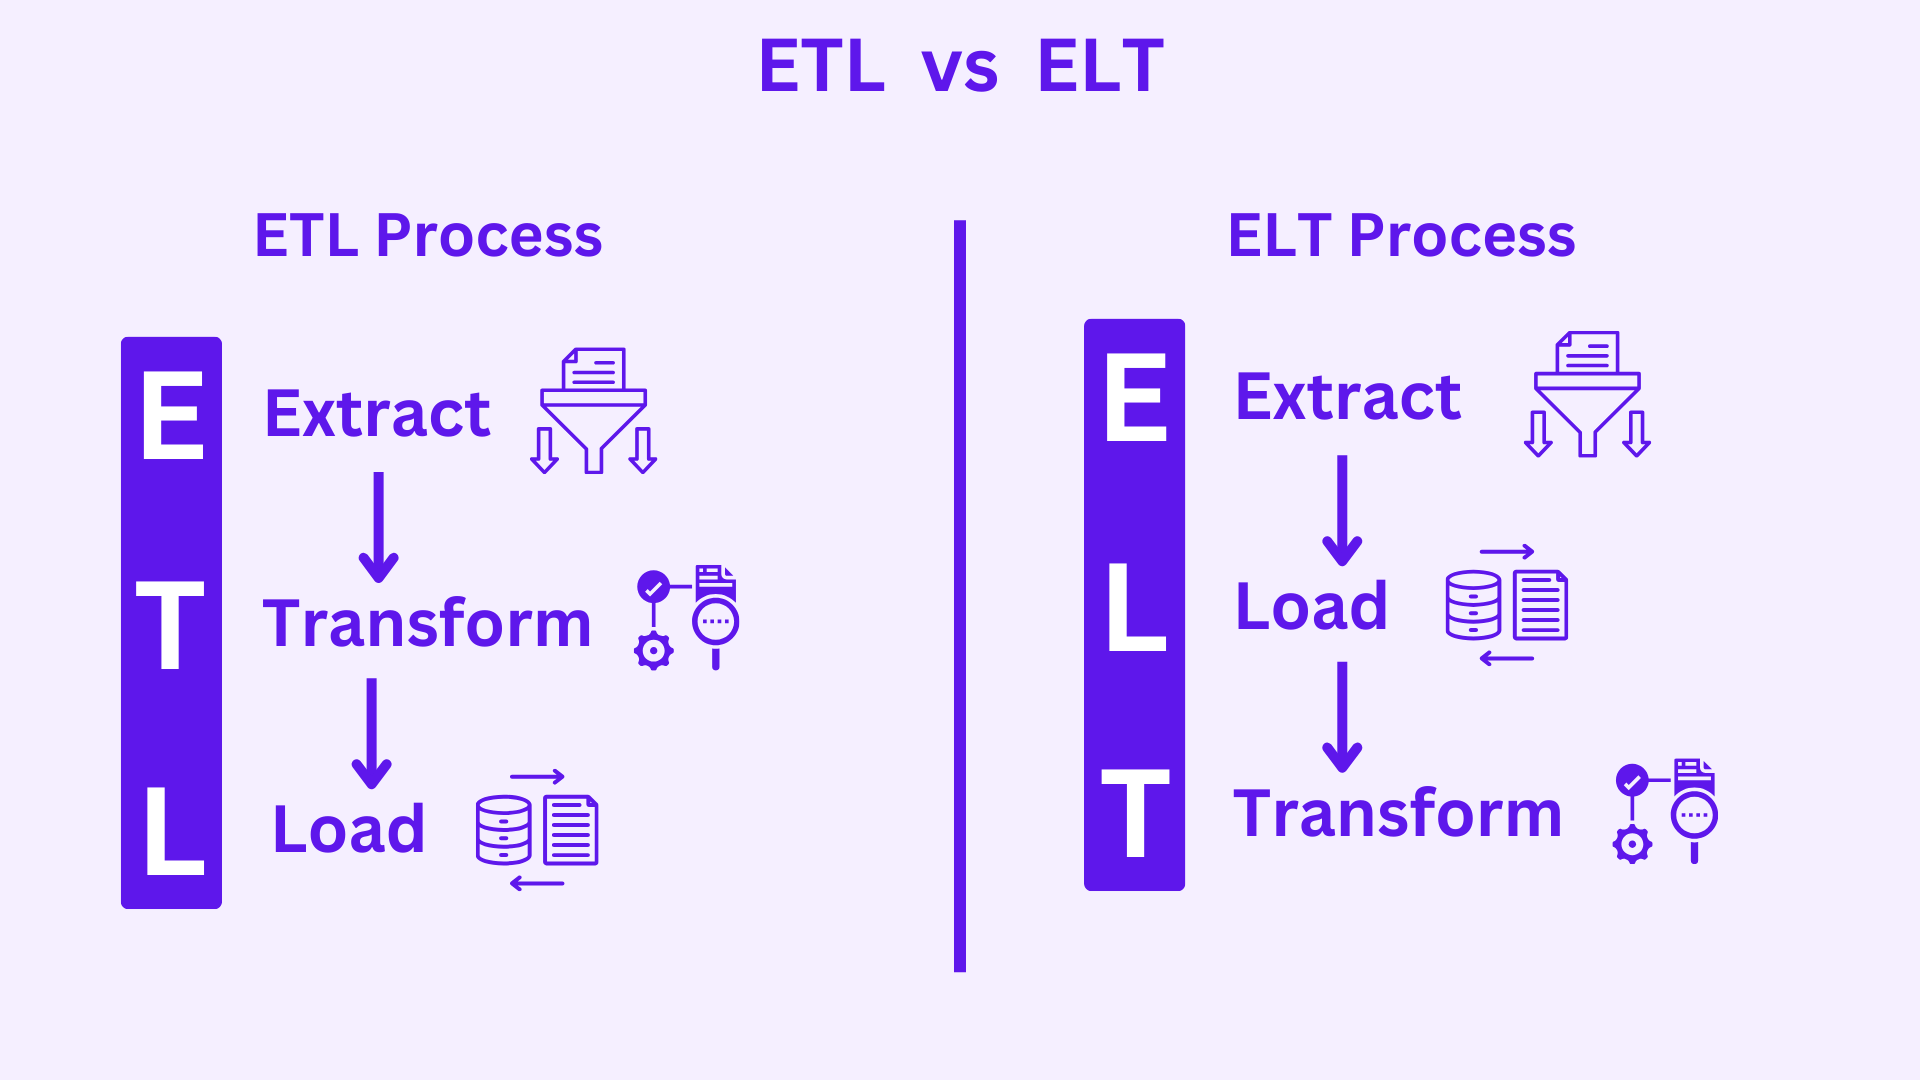
ETL stands for Extract, Transform, and Load.

The following steps are commonly included in the ETL process:

Extract: The data is extracted from the source systems.

Transform: The data is transformed into a consistent format. This may involve cleaning the data, removing duplicates, and converting data types.

Load: The data is loaded into the data warehouse or data lake.

ELT stands for Extract, Load, and Transform. 

The ELT process typically involves the following steps:

Extract: The data is extracted from the source systems.

Load: the stored extracted data is loaded into the data warehouse or data lake.

Transform: The data is transformed in the data warehouse or data lake. This may involve cleaning the data, removing duplicates, and converting data types.

The order in which the data is changed is the main difference between ETL and ELT. ETL transforms data before it is loaded into a data warehouse or data lake. In ELT, data is initially put into the data warehouse or data lake and then converted.

Similarities between ETL and ELT

Both extract, transform, and load (ETL) and extract, load, and transform (ELT) are sequences of processes that prepare data for further analysis. They capture, process, and load data for analysis across three steps:

Extraction: Extraction is the first step of both ETL and ELT. This step is about collecting raw data from different sources.

Transformation: This step focuses on changing raw data from its original structure into a format that meets the requirements of the target system where you plan to store the data for analytics. Some transformation types are changing data types or formats, removing inconsistent or inaccurate data and removing data duplication.

Loading: In this step, the data is stored into the target database.

How do the ELT and ETL processes differ from each other?

ETL process has three steps:

  • You extract raw data from various sources
  • You use a secondary processing server to transform that data
  • You load that data into a target database

These are the three steps of ELT process:

  • You extract raw data from various sources
  • You load it in its natural state into a data warehouse or data lake
  • You transform it as needed while in the target system

With ELT, all data cleansing and transformation occurs within the data warehouse. You can use and transform the raw data as much as needed.

When to use ETL vs. ELT
ELT (extract, load, and transform) is the industry standard for modern analytics. However, in the following cases, you should consider extract, transform, and load (ETL).

Legacy Databases: It is sometimes more advantageous to use ETL to interface with legacy databases or third-party data sources that use predefined data formats. It simply needs to be transformed and loaded once into your system. You may use it more efficiently for all future analytics once it has been changed.

Experimentation: Experiments are carried out by data engineers in large organisations, such as identifying hidden data sources for analytics and testing novel concepts to solve business queries. ETL is important in data studies to better understand the database and its utility in a given context.

Complex analytics: ETL and ELT can be used jointly for complicated analyses that use numerous data formats from many sources. Data scientists can create ETL pipelines from some sources and use ELT for the rest. In some circumstances, this enhances analytics efficiency and increases the performance of applications.