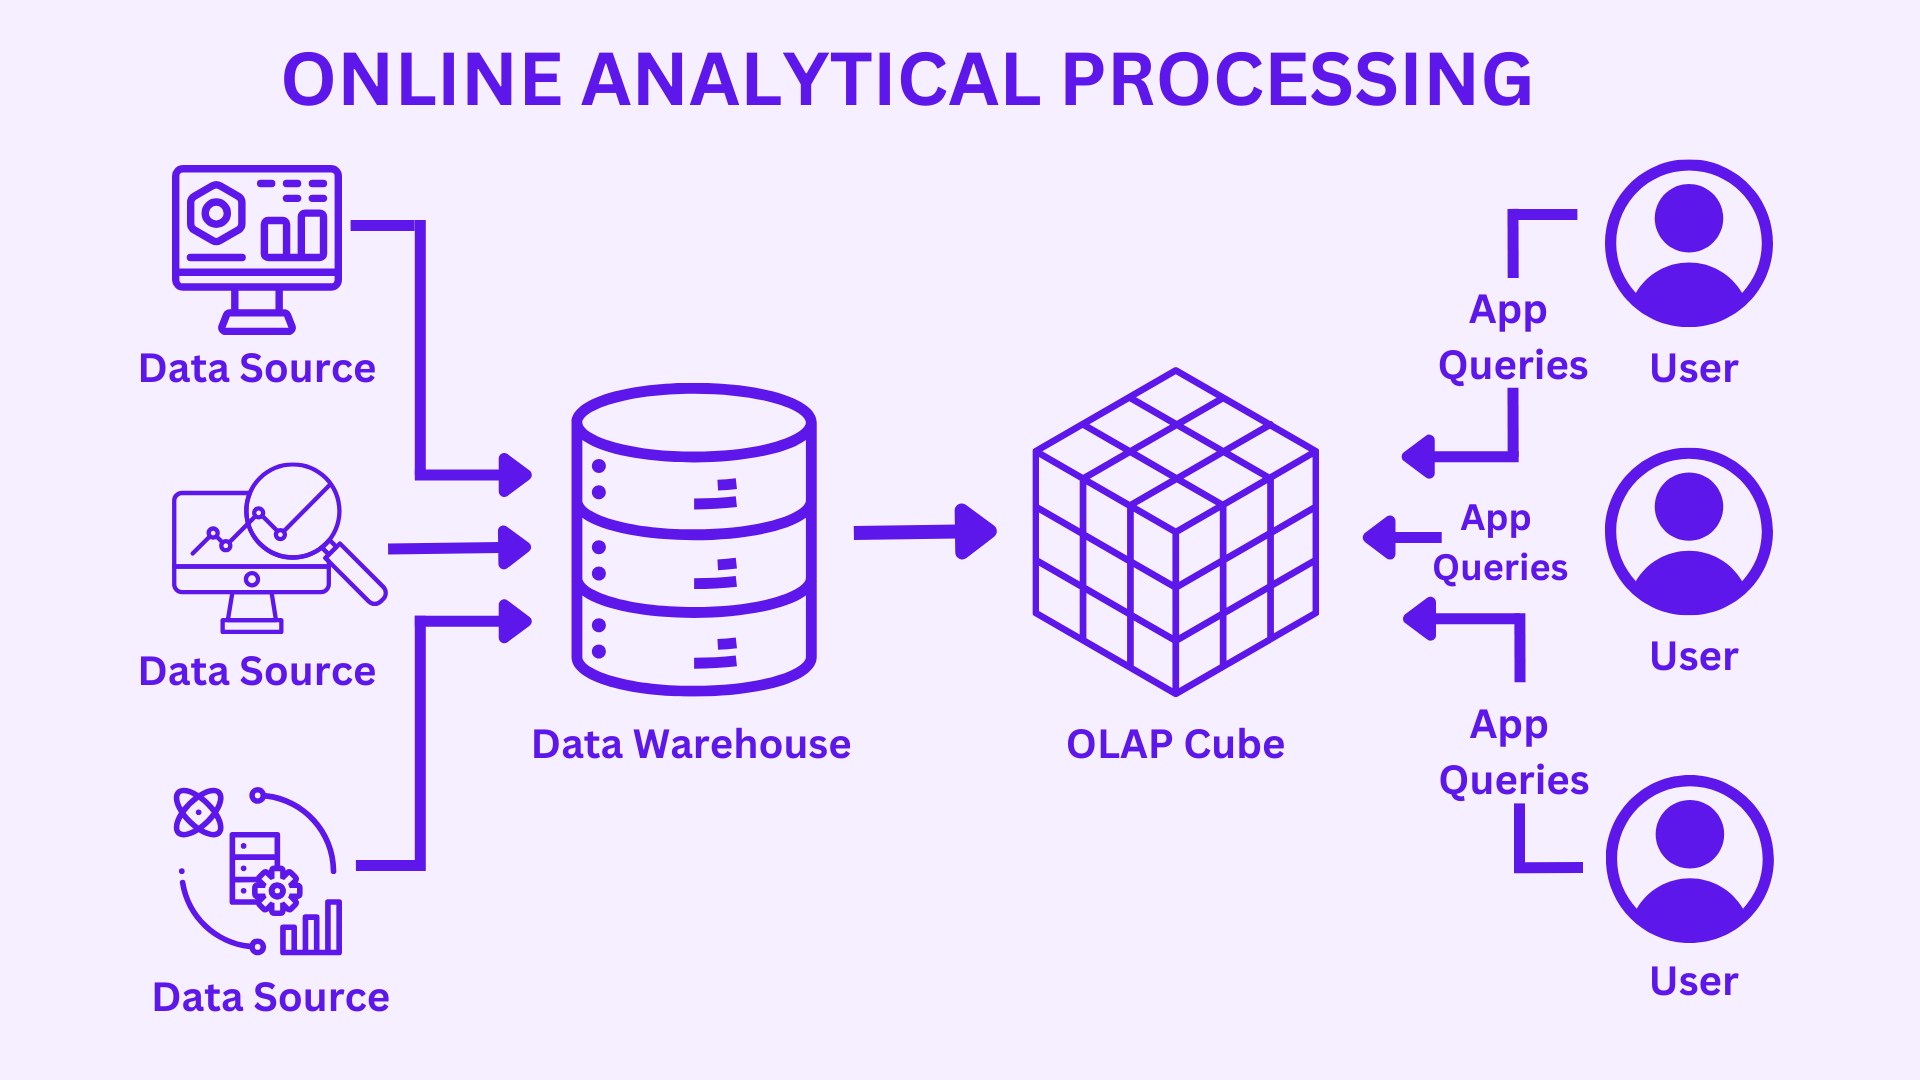
OLAP | Online Analytical Processing

Online analytical processing (OLAP) is an analytical technology that organizes large business databases and supports complex analysis. It is used to perform complex analytical queries without negatively affecting transactional systems.
The databases that a business uses to store all its transactions and records are called online transaction processing (OLTP) databases. These databases usually have records that are entered one at a time. The databases that are used for OLTP, however, were not designed for analysis.
OLAP systems were designed to help extract this business intelligence information from the data in a highly performant way. This is because OLAP databases are optimized for heavy read, low write workloads.
OLAP combines and groups this data into categories to provide actionable insights for strategic planning.
Why is OLAP important?
Online analytical processing (OLAP) helps organizations process and benefit from a growing amount of digital information. Some benefits of OLAP include the following:
- Faster decision making – Businesses use OLAP to make quick and accurate decisions to remain competitive in a fast-moving economy. Performing analytical queries on multiple relational databases is time consuming & lengthy because the computer system searches through multiple data tables. On the other hand, OLAP systems pre calculates and integrates data so business analysts can generate reports faster when needed.
- Non-technical user support – OLAP systems make complex data analysis easier for non-technical business users. Business users can create complex analytical calculations and generate reports instead of learning how to operate databases.
- Integrated data view – OLAP provides a unified platform for marketing, finance, production, and other business units. Managers and decision makers can see the bigger picture and effectively solve problems. They can perform what-if analysis, which shows the impact of decisions taken by one department on other areas of the business.
Data engineers build a multidimensional OLAP system that consists of the following elements:
- Data warehouse – A data warehouse collects information from different sources, including applications, files, and databases. It processes the information using various tools so that the data is ready for analytical purposes.
- ETL tools – Extract, transform, and load (ETL) tools are database processes that automatically retrieve, change, and prepare the data to a format fit for analytical purposes. Data warehouses uses ETL to convert and standardize information from various sources before making it available to OLAP tools.
Read more about ETL in my detailed blog here.
- OLAP server – An OLAP server is the underlying machine that powers the OLAP system. It uses ETL tools to transform information in the relational databases and prepare them for OLAP operations.
- OLAP database – An OLAP database is a separate database that connects to the data warehouse. Data engineers sometimes use an OLAP database to prevent the data warehouse from being burdened by OLAP analysis. They also use an OLAP database to make it easier to create OLAP data models.
- OLAP cubes – A data cube is a model representing a multidimensional array of information. While it is easier to visualize it as a three-dimensional data model, most data cubes have more than three dimensions. An OLAP cube, or hypercube, is the term for data cubes in an OLAP system. OLAP cubes are rigid because you cannot change the dimensions and underlying data once you model it.
- OLAP analytic tools – Business analysts use OLAP tools to interact with the OLAP cube. They perform operations such as slicing, dicing, and pivoting to gain deeper insights into specific information within the OLAP cube. Popular OLAP analytical tools include Apache Kylin, IBM Cognos, Essbase etc.
Types of OLAP
Online analytical processing (OLAP) systems operate in three main ways:
MOLAP – Multidimensional online analytical processing (MOLAP) involves creating a data cube that represents multidimensional data from a data warehouse. Data engineers use MOLAP because this type of OLAP technology provides fast analysis.
ROLAP – Relational online analytical processing (ROLAP) allows data engineers to perform multidimensional data analysis on a relational database. ROLAP is suitable for analysing extensive and detailed data.
HOLAP – Hybrid online analytical processing (HOLAP) combines MOLAP and ROLAP to provide the best of both architectures. HOLAP allows data engineers to quickly retrieve analytical results from a data cube and extract detailed information from relational databases.
For all the benefits OLAP systems provide, they do produce a few challenges:
- Whereas data in OLTP systems is constantly updated through transactions flowing in from various sources, OLAP data stores are typically refreshed at a much slower intervals, depending on business needs. This means OLAP systems are better suited for strategic business decisions, rather than immediate responses to changes. Also, some level of data cleansing and orchestration needs to be planned to keep the OLAP data stores up to date.
- Unlike traditional, normalized, relational tables found in OLTP systems, OLAP data models tend to be multidimensional. This makes it difficult or impossible to directly map to entity-relationship or object-oriented models, where each attribute is mapped to one column. Instead, OLAP systems typically use a star or snowflake schema in place of traditional normalization.
Consider OLAP in the following scenarios:
- Providing business users simpler way to generate reports from data present in data warehouse.
- Providing several aggregations that will allow users to get proper consistent results.
OLAP is especially useful for applying aggregate calculations over large amounts of data. OLAP systems are optimized for read-heavy scenarios, such as analytics and business intelligence.
OLAP allows users to segment multi-dimensional data into slices that can be viewed in two dimensions (such as a pivot table) or filter the data by specific values. This process is sometimes called “slicing and dicing” the data and can be done regardless of whether the data is partitioned across several data sources. This helps users to find trends, spot patterns, and explore the data without having to know the details of traditional data analysis.
