
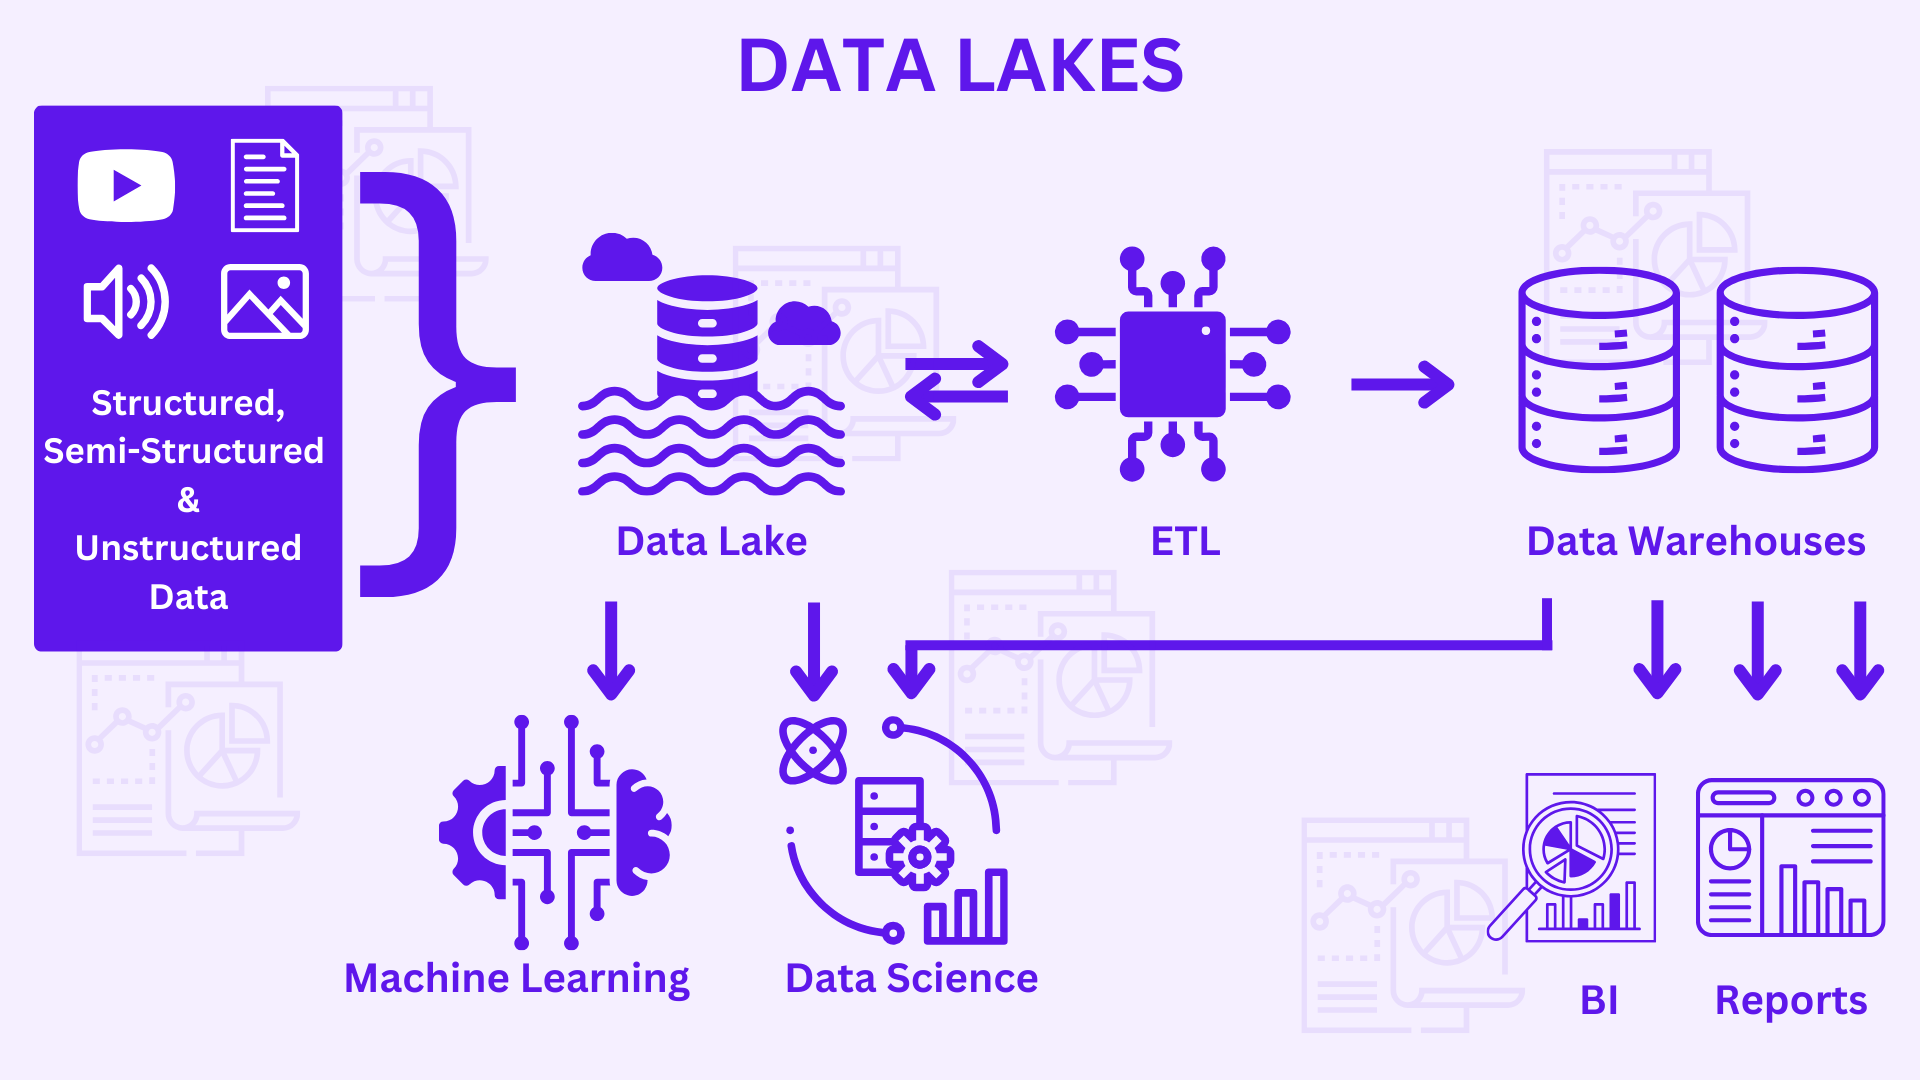
Data Lakes
Data Lakes are a centralised repository of raw data & has the ability to store structured, semi-structured and unstructured data from various sources including databases, social media and sensors. Data lakes are frequently used to store data for future study, such as machine learning and AI.
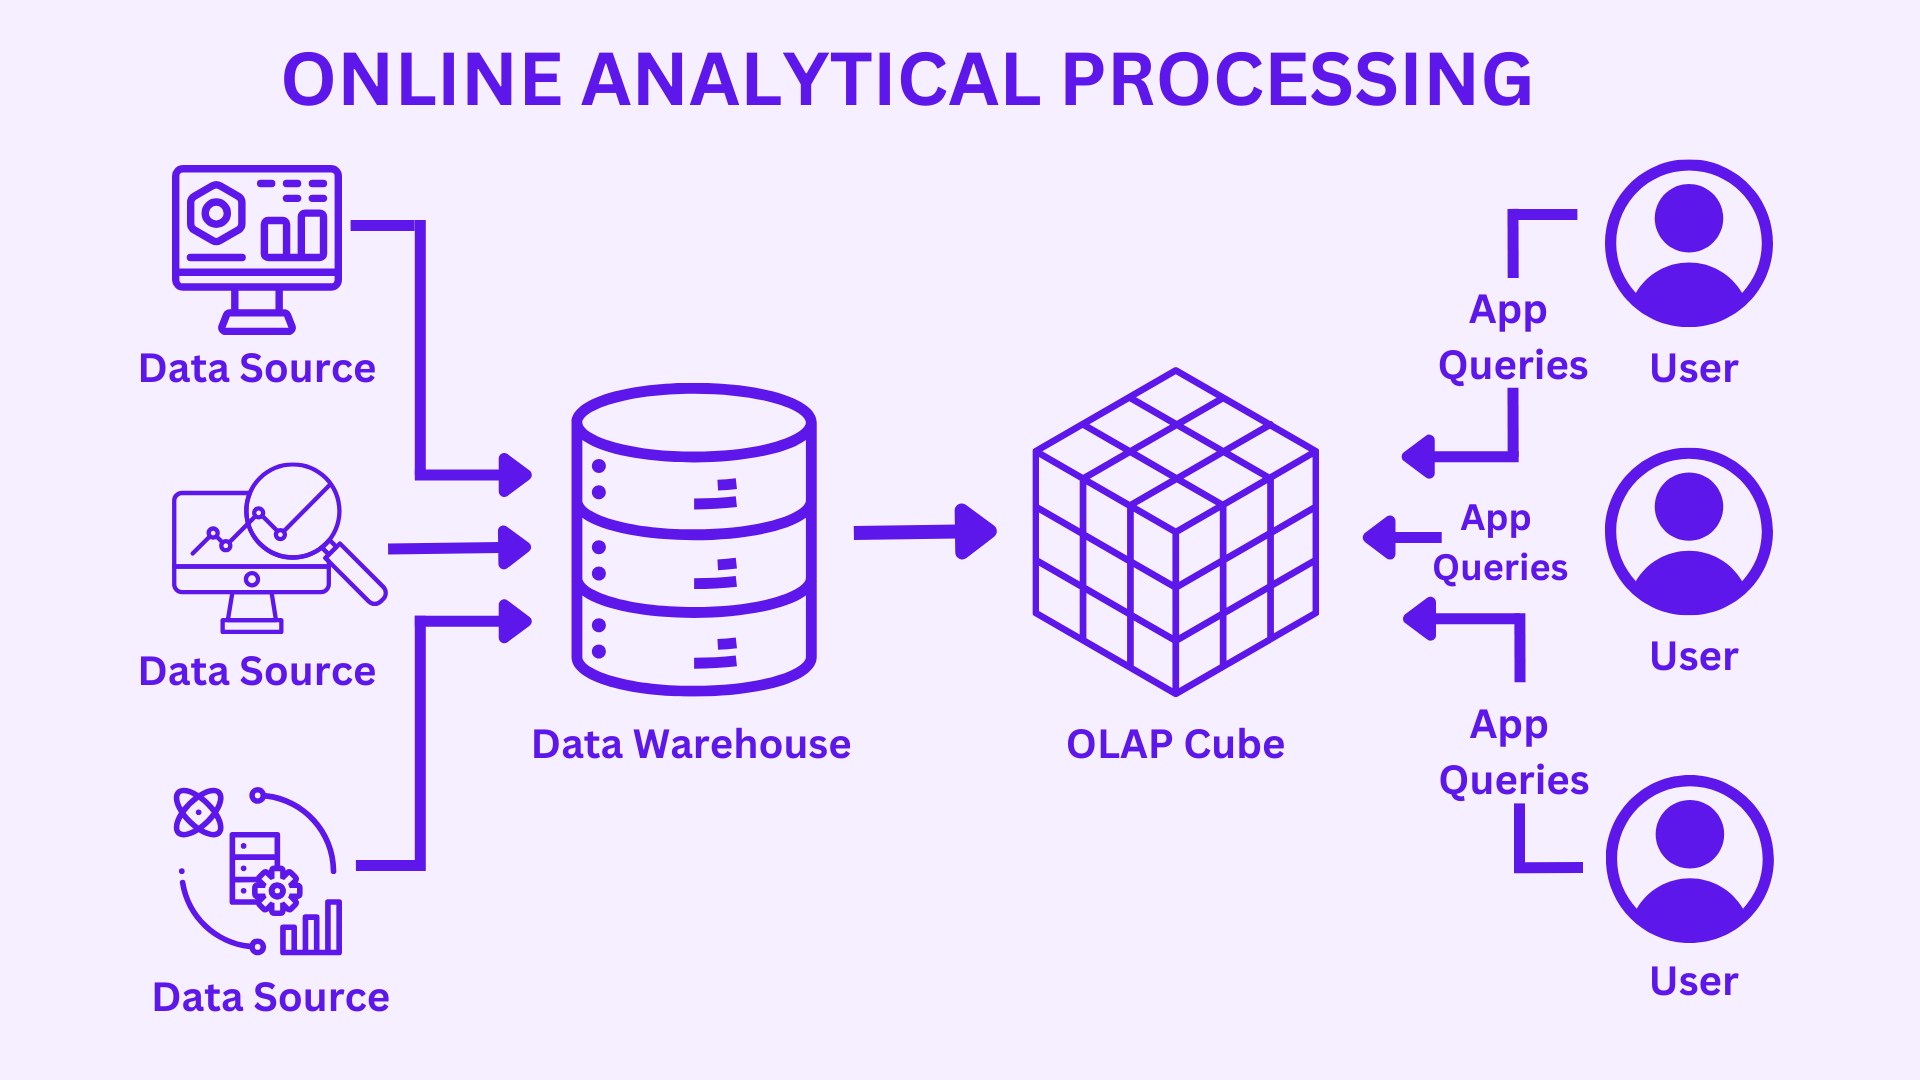
OLAP – Online Analytical Processing
OLAP systems typically store data in a multidimensional format, which allows users to slice and dice the data to see different relationships and trends.
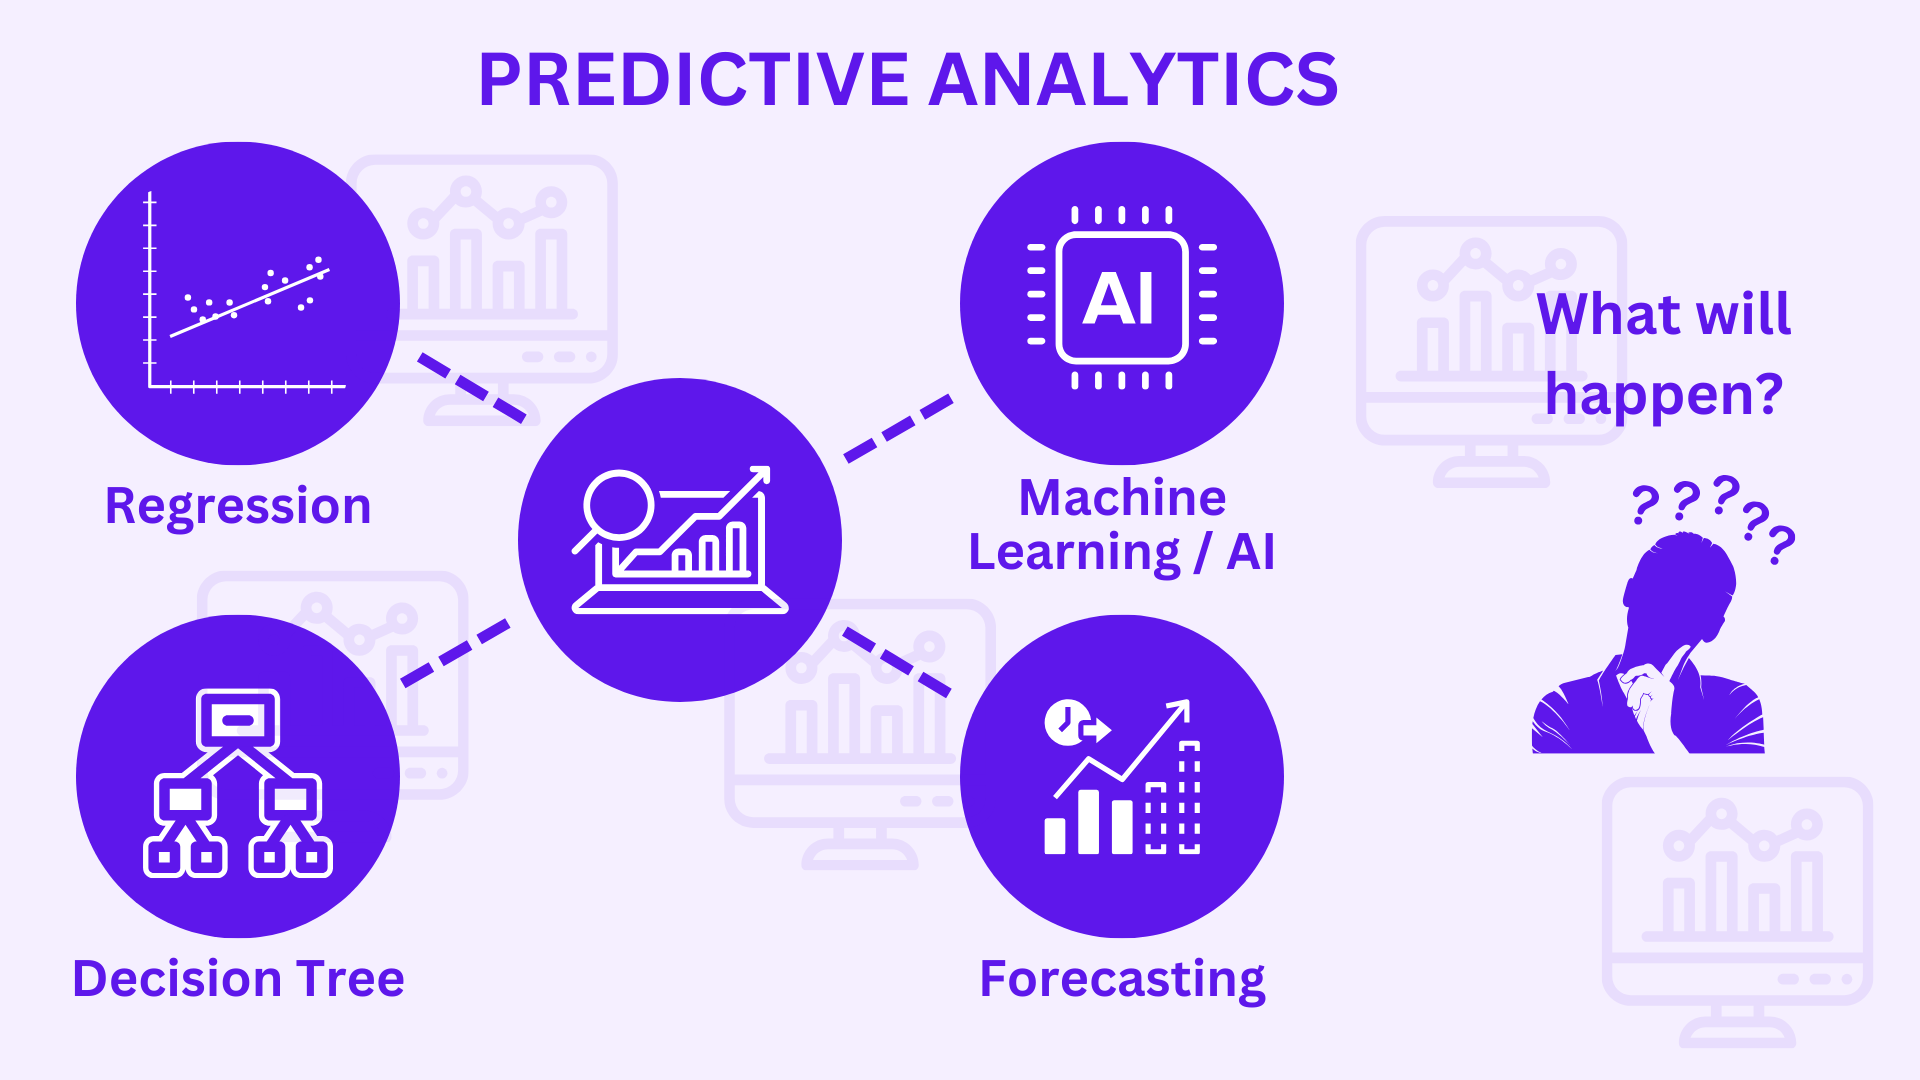
Predictive Analytics
Predictive Analytics helps us take what we know about what happened in the past, & use that information to help us predict what will happen in the future. This analytical method involved application of advanced statistical methods or other numeric techniques such as linear regression or logistic regression.

Information-Action Value Chain
The information-action value chain is a framework that helps organizations understand how information can be used to create value. It basically consists of three parts, namely before the methods, the methods and after the methods.
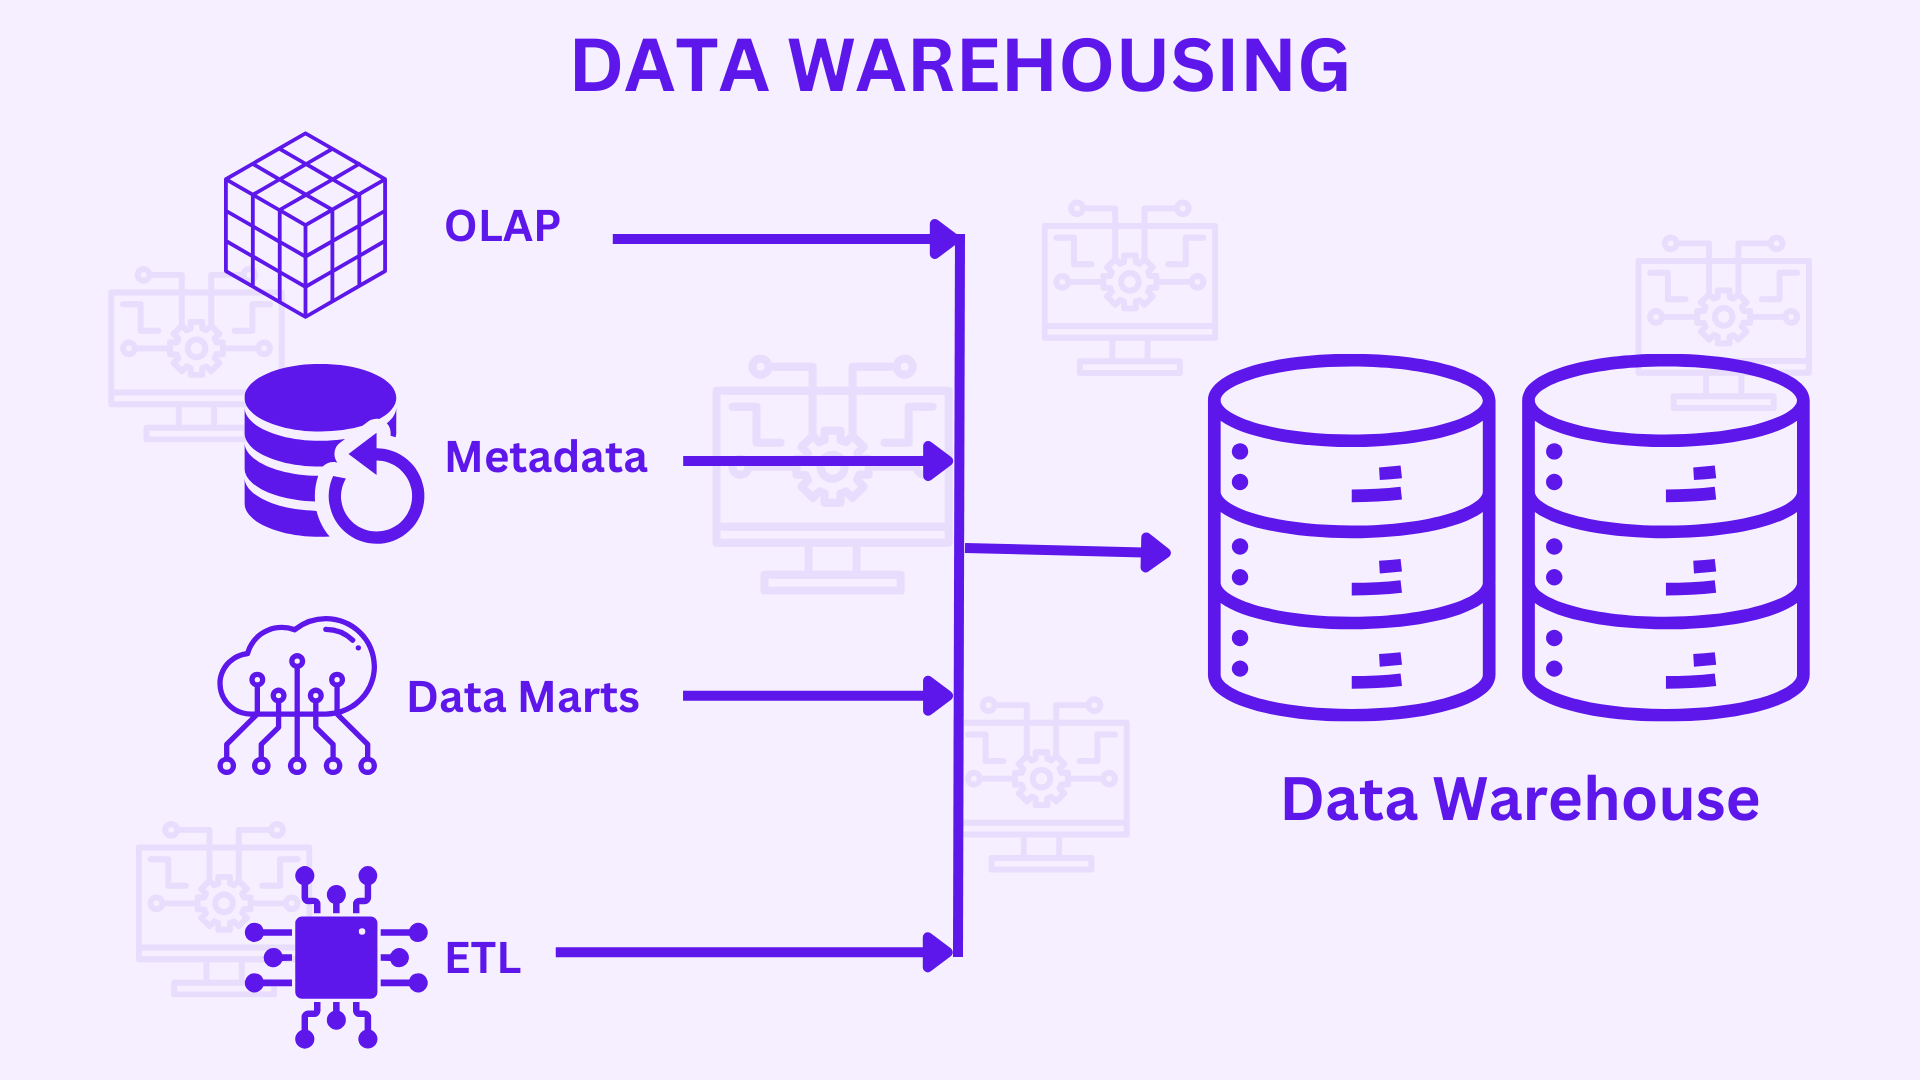
Data Warehouses
Data Warehouses are a central repository for data that has been merged from one or more diverse sources. Data warehouses are used to support BI activities like data mining, online analytical processing (OLAP), and business reporting.
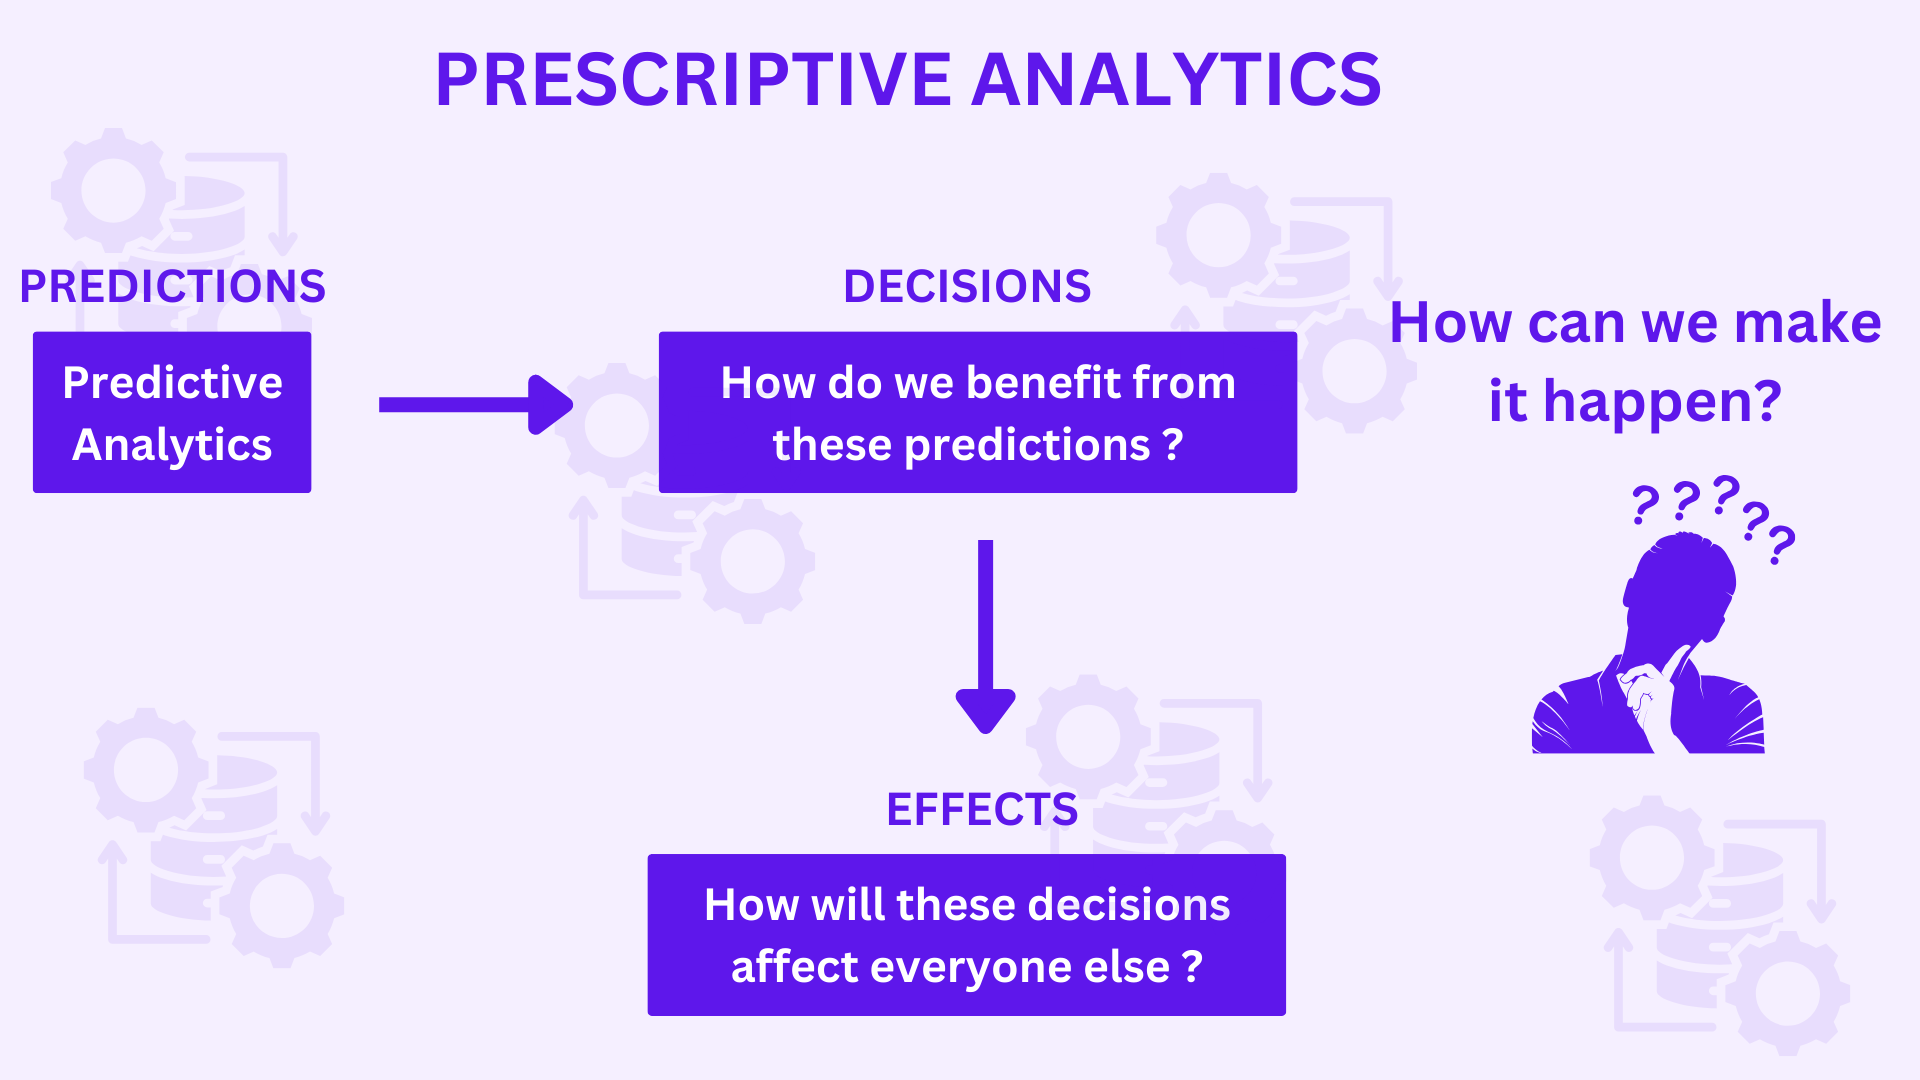
Prescriptive Analytics
Prescriptive Analytics helps explicitly link analysis to decision making by making recommendations on what we should do or what choice we should make to achieve a certain outcome. This analytical method involves integration of numerical optimisation techniques with business rules and even financial models.

Data Mart
Data Marts are a subset of a data warehouse that is tailored to the needs of a particular business unit or department. Data marts often contain data important to a specific business area, such as sales, marketing, or finance.
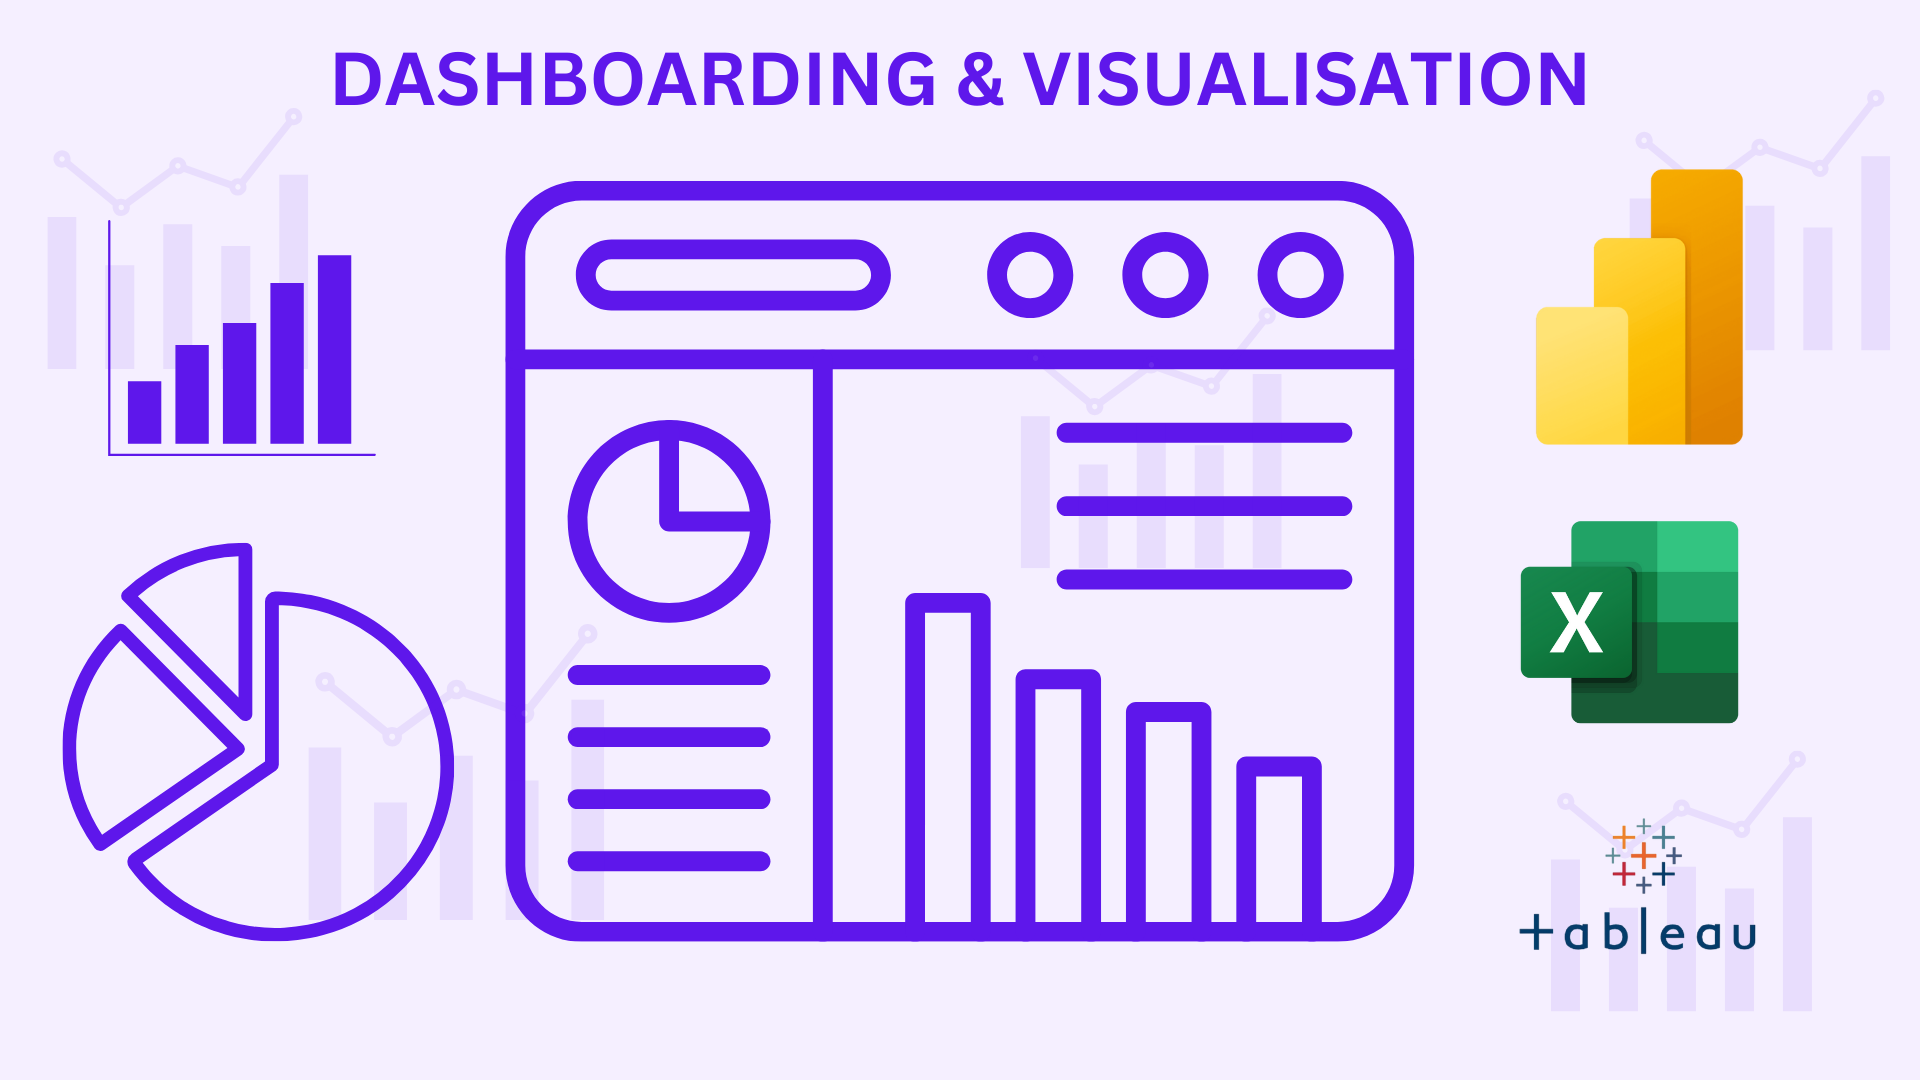
Dashboarding & Visualization
Visualization and dashboarding are two related concepts that are used to communicate data to audiences & stakeholders in a way that is easy to understand.
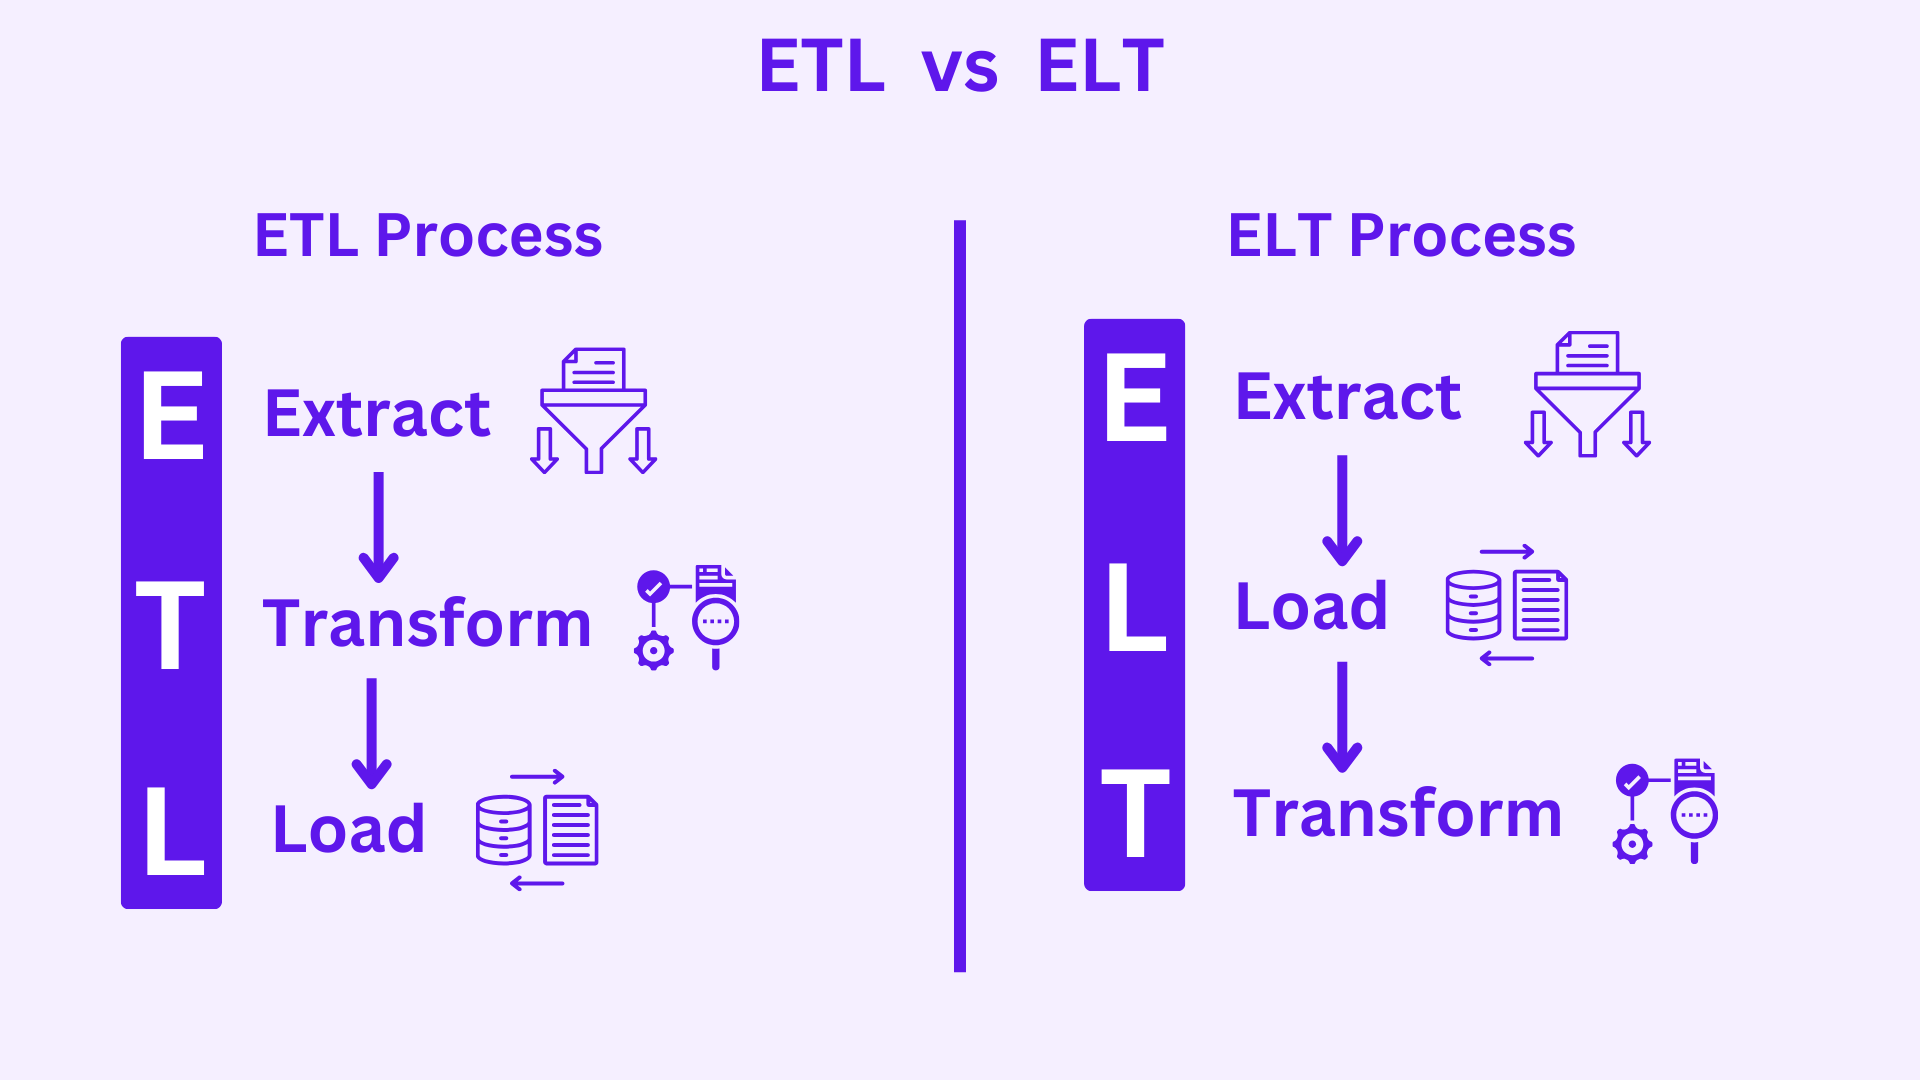
ETL vs ELT
ETL and ELT are two data integration methodologies that are used to extract data from different sources, transform it into a consistent format, and load it into a data warehouse or data lake.